Random decay and background radiation
Key idea: Radioactive decay needs no trigger, and individual decay times are unpredictable. Counts fluctuate around a mean; subtract background rates and distinguish detector counts from actual activity.
Offline pages
Saved on this device only. Connect at least once every 30 days to confirm Premium. Sign-out or a change of account removes saved copies.
Loading guide controls…
Guided lessons · coming soon
Guided lesson
Guided steps
- Explain why an old nucleus is not due to decay.
- Read what fluctuating counts tell you about individual decays.
- Decide whether the next count must compensate for this one.
- Tell a detector count rate apart from source activity.
- Follow why different counting times need separate rate calculations.
- Find both rates, then subtract background.
- Find the mean net rate for the repeated readings.
- Explain whether one fall shows the source getting weaker.
- Explain random decay and why you subtract background rates.
On this page
You stopped at:
ContinueHold a detector at a fixed distance from a radioactive source and count for 20 s at a time. The readings come out as 214, then 198, then 221. Nothing is wrong with the detector: radioactive decay is random, so equal intervals give unequal counts. This lesson explains what “spontaneous” and “random” mean, how the scatter in count readings shows that decay is random, and why every measurement must allow for background radiation.
Spontaneous and random decay
Spontaneous decay happens without an external trigger. For the radioactive decays studied here, ordinary changes in temperature, pressure or chemical combination do not change the decay constant. Those changes mainly affect electrons and chemical bonds, with energies far smaller than typical nuclear energies. They do not control when these nuclei decay.
Random decay means you cannot predict when a particular nucleus will decay, or which nucleus in a sample will decay next. Every undecayed nucleus of the same nuclide has the same fixed probability of decaying in the next second. That probability does not grow with age: a nucleus that has survived for a long time is not “due” to decay.
Random behaviour of single nuclei still gives a predictable average for a large sample. If each nucleus has the same chance of decaying per second, the number decaying per second is, on average, proportional to the number left. That gives the smooth exponential decay of a large sample.
Fluctuating counts show that decay is random
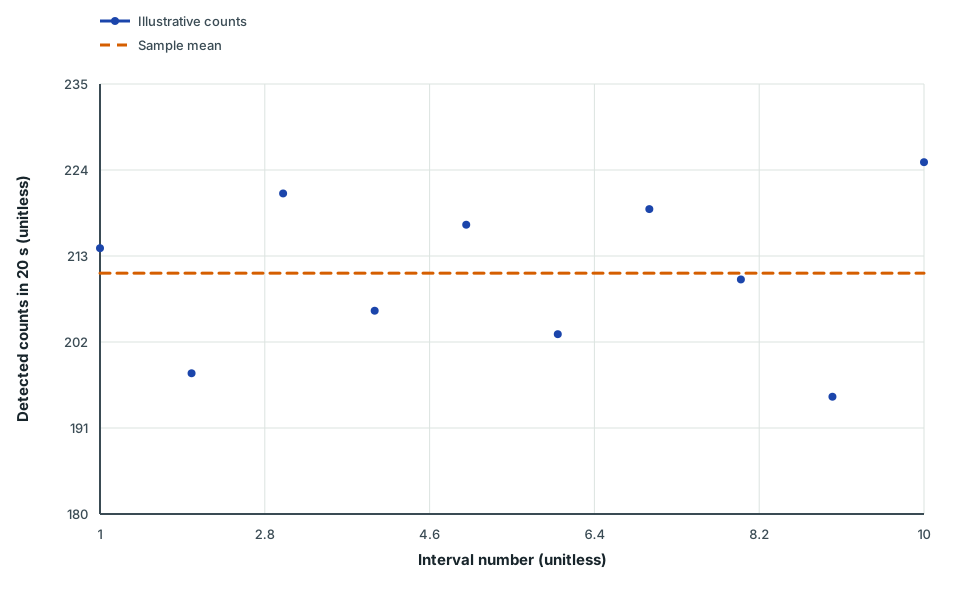
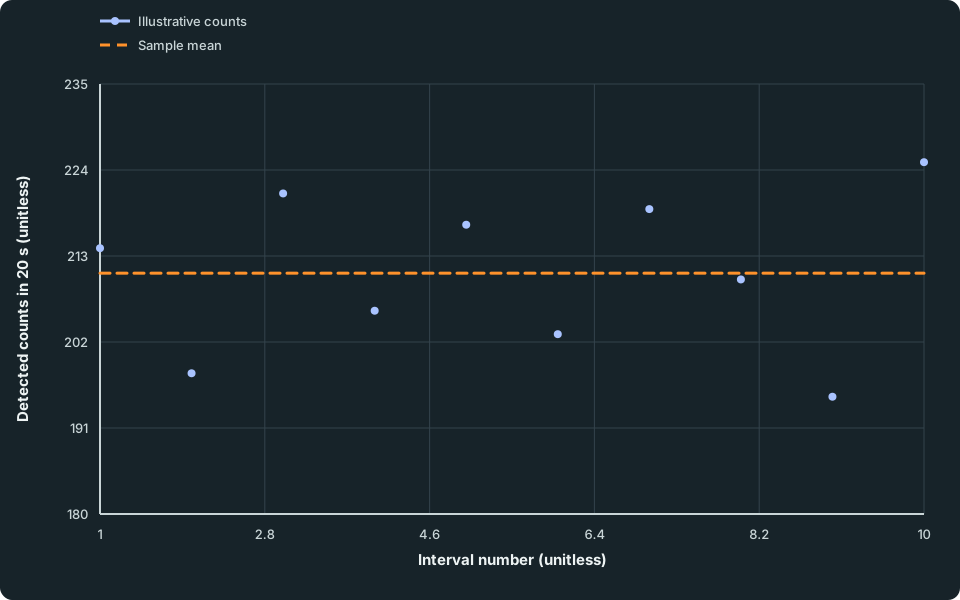
With the source, detector and shielding all fixed, the counts scatter above and below a mean. Use a source whose activity changes negligibly during the measurements, so that a falling average does not explain the scatter.
Fluctuating counts in equal 20 s intervals
Ten count totals in successive 20-second intervals scatter above and below a horizontal sample mean of 210.8 counts.
Scroll across the figure to read all labels.
View figure data
| Series | Interval number (unitless) | Detected counts in 20 s (unitless) |
|---|---|---|
| Illustrative counts | 1 | 214.0 |
| Illustrative counts | 2 | 198.0 |
| Illustrative counts | 3 | 221.0 |
| Illustrative counts | 4 | 206.0 |
| Illustrative counts | 5 | 217.0 |
| Illustrative counts | 6 | 203.0 |
| Illustrative counts | 7 | 219.0 |
| Illustrative counts | 8 | 210.0 |
| Illustrative counts | 9 | 195.0 |
| Illustrative counts | 10 | 225.0 |
| Sample mean | 1 | 210.8 |
| Sample mean | 10 | 210.8 |
The mean activity changes very little during these ten intervals, yet the readings range from 195 to 225. This scatter is the evidence that individual decays happen at random times. The mean summarises the readings; it does not predict the next one.
The scatter becomes smaller compared with the count when you count for longer. That is why a reliable count rate comes from a long counting time or many repeated intervals.
Check your understanding 1
The reading in one interval is well above the mean. Must the next reading be below the mean to make up for it?
Show answer
No. Each decay is independent of the ones before, so the next interval does not compensate for the last. It can be above or below the mean.
Counts, count rate and activity
A count is one pulse registered by the detector. The count rate is the number of counts divided by the counting time, in counts s⁻¹ or counts min⁻¹.
Activity is the number of nuclei in the source decaying per second, measured in becquerels: 1 Bq is one decay per second. A count rate is almost always smaller than the activity, because emissions go off in all directions and most miss the detector, some are absorbed on the way, and some pass through without producing a pulse. So a count rate is not an activity, even though both have the unit s⁻¹.
Keep the source–detector arrangement fixed when you compare count rates. Then the count rate is a fixed fraction of the activity, and changes in one follow changes in the other.
Background radiation
A detector registers counts even when no source is present. This background radiation comes from:
- radon gas, which seeps out of rocks and soil and collects in buildings: the largest natural source for most people;
- radioactive nuclides in rocks, soil and building materials such as granite and concrete;
- cosmic rays from space, and the particles they produce in the atmosphere;
- radioactive nuclides in food, water and our own bodies, such as potassium-40 and carbon-14;
- small amounts of radioactive material from past nuclear weapons tests and the nuclear industry.
Medical X-rays and nuclear-medicine procedures also contribute to a person’s radiation exposure, but a nearby medical exposure is not a steady background for every laboratory detector.
Background matters in two ways. Everyone receives a small, unavoidable dose from it. And every count-rate measurement includes it, so you must measure it with the source removed and subtract it. Background counts also fluctuate, so count for a long time to get a reliable mean background rate.
The correction subtracts rates, not counts:
Both rates must be in the same unit. Counts collected over different times cannot be subtracted directly.
Worked example 1
Net count rate with different counting times
Problem
With the source absent, 36 counts are recorded in 60 s. With the source present, 210 counts are recorded in 70 s. Find the net count rate from the source.
Show full solution
Find the background rate
Method
Divide the background count by its own time.Reason
The two counts were taken over different times, so only rates can be compared.Working
Answer
R_background = 36/60 = 0.60 counts s⁻¹
Find the source-plus-background rate
Method
Divide the source-present count by its own time.Reason
This reading includes background, so it must be a rate in the same unit before you subtract.Working
Answer
R_measured = 210/70 = 3.00 counts s⁻¹
Subtract the rates
Working
Answer
Rₙₑₜ = 3.00-0.60 = 2.40 counts s⁻¹
Quick check
Subtracting 210-36 would compare 70 s of counting with 60 s. Converting each total to a rate first makes the subtraction meaningful.
Check your understanding 2
Background is 120 counts in 200 s. With the source present, 620 counts are recorded in 100 s. Find the net count rate from the source.
Show the steps Optional working
Show solution
R_background = 120/200 = 0.60 counts s⁻¹ and R_measured = 620/100 = 6.20 counts s⁻¹, so Rₙₑₜ = 5.60 counts s⁻¹.
Try it yourself 2
Is the source getting weaker?
Problem
A long-lived source gives 52, 47, 55, 46 and 50 counts in five successive 20 s intervals. Background, measured separately, is 90 counts in 300 s. A student says the source is getting weaker because the fourth reading is lower than the third.
Find the mean net count rate.
Find the mean net rate
Show the steps Optional working
Hints
Hint 1
pool the readings
Add all five counts and divide by the total counting time. Convert the background to a rate in the same unit.
Show full solution
Find the mean net rate
Reason
Pooling all the counts gives a more reliable mean than any single interval.Working
Answer
250 counts in 100 s gives 2.50 counts s⁻¹. Background is 90/300 = 0.30 counts s⁻¹, so Rₙₑₜ = 2.50-0.30 = 2.20 counts s⁻¹.
Check your understanding 3
Use the five readings above. The student says the source is getting weaker because the fourth count is lower than the third. Explain whether that one fall shows a loss of activity.
Show answer
The fall from 55 to 46 does not by itself show a weaker source. Random decay makes counts fluctuate in equal intervals; these readings rise again to 50 and show no steady downward trend. A long-lived source changes negligibly during 100 s. Check that your answer compares all five readings and explains why one pair is insufficient.
Before you move on
Check your understanding 4
Without looking back: what does “random” mean for radioactive decay, and what observation shows it? Then name two sources of background radiation and say why you subtract rates rather than counts.
Show answer
Random means you cannot predict when a particular nucleus will decay; each has the same fixed chance per unit time. The evidence is that a fixed detector and source give fluctuating counts in equal intervals. Sources of background include radon gas, rocks and building materials, cosmic rays, radioactive nuclides in food and the body, and small amounts of artificial radioactive material. Counts depend on the counting time, so only rates over the same unit of time can be subtracted.
Spotted an error? Report a correction
Syllabus and review details
- GCE A-Level H2 Physics 2027 · 2027
Content Overview, PDF pages 9–10; Subject Content, PDF pages 11–30
Last reviewed: