Resonance
Key idea: Explain resonance using forced oscillations, interpret amplitude–frequency response curves, and discuss useful vs dangerous resonance (A Level Physics).
Continue where you stopped
The core idea
On this page
Learning objectives
- Distinguish free and forced oscillations, natural frequency and driving frequency.
- Interpret resonance response curves, damping effects and practical applications.
1. Definitions (Must Know)
A. Forced oscillation
A forced oscillation occurs when a system is driven by an external periodic force.
B. Natural frequency
The natural frequency is the frequency at which the system oscillates when it is left to vibrate freely.
C. Resonance
Resonance is the maximum steady-state amplitude produced when the driving frequency is close to, or at, the natural frequency. Damping can move the response maximum slightly below the undamped natural frequency.
D. Frequency response curve
A frequency response curve is a graph of oscillation amplitude against driving frequency.
2. Key Ideas (What Earns Marks)
- Resonance corresponds to a peak in the amplitude–frequency response.
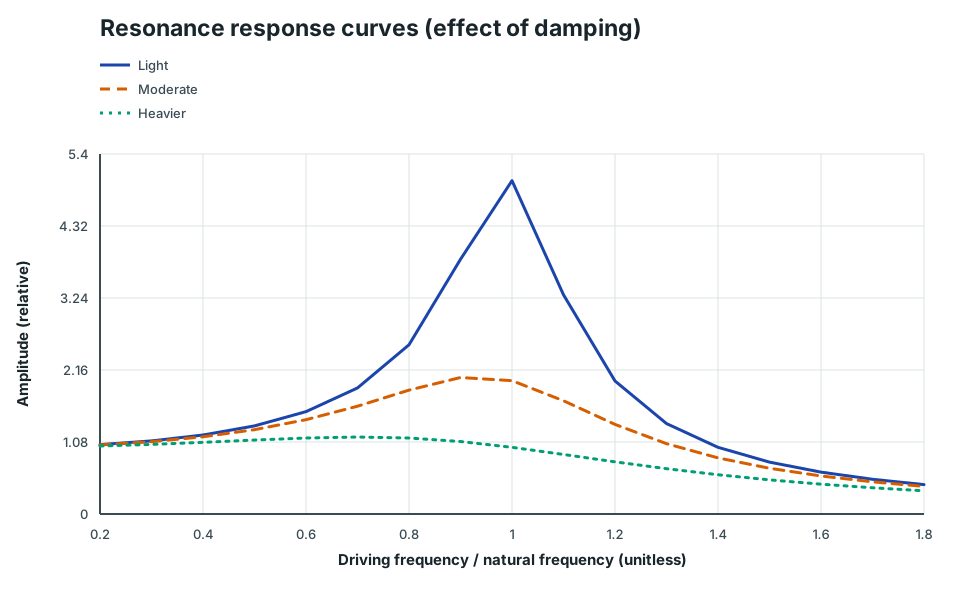
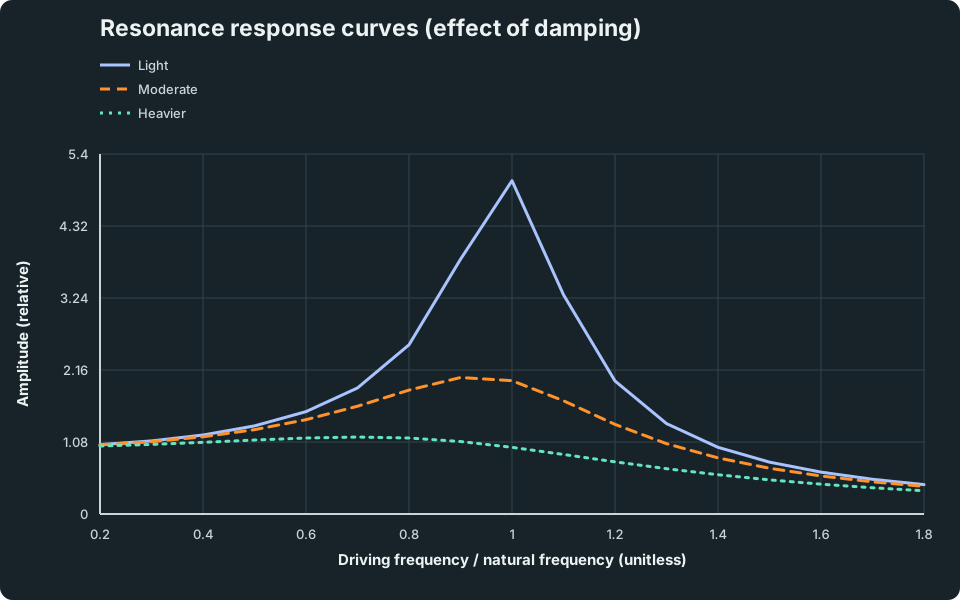
- Damping reduces the peak amplitude and makes the peak less sharp (broader).
- Resonance can be useful (amplify a desired response) or dangerous (excessive vibration/stress).
See: Damping and Natural Frequency.
3. Detailed Explanations
A. Response curves (qualitative shapes)
This plot shows the typical effect of damping on the resonance peak (shape only).
Resonance response curves (effect of damping)
Amplitude response versus driving frequency ratio for light, medium, and heavy damping; increasing damping lowers and broadens the peak.
Scroll across the graph to read all labels.
View figure data
| Driving frequency / natural frequency (unitless) | Light | Moderate | Heavier |
|---|---|---|---|
| 0.2 | 1.0407636178045332 | 1.0360608425945603 | 1.0197712705600053 |
| 0.30000000000000004 | 1.0965202319032639 | 1.0842696731877575 | 1.043650309657746 |
| 0.4 | 1.1851136578499433 | 1.1581026365301987 | 1.0748339509808695 |
| 0.5 | 1.3216372009101796 | 1.2649110640673518 | 1.1094003924504583 |
| 0.6000000000000001 | 1.535737792084878 | 1.414779587435732 | 1.139901881468883 |
| 0.7 | 1.8908355841512123 | 1.6166928483211829 | 1.154623566040508 |
| 0.8 | 2.538365412834048 | 1.858235365617916 | 1.139901881468883 |
| 0.9000000000000001 | 3.820803599504353 | 2.047221247580857 | 1.0871492046706062 |
| 1 | 5 | 2 | 1 |
| 1.1 | 3.2879797461071445 | 1.6985788839624956 | 0.8929639290487886 |
| 1.2 | 1.9952172111690554 | 1.344008326426176 | 0.7823969299055072 |
| 1.3 | 1.3561893622089956 | 1.0549133608861843 | 0.6794550781149664 |
| 1.4000000000000001 | 0.9999999999999998 | 0.8416745106420596 | 0.5890920370328413 |
| 1.5 | 0.777909841584414 | 0.6859943405700353 | 0.5121475197315839 |
| 1.6 | 0.6279504491291602 | 0.5703958094953441 | 0.44750008726252544 |
| 1.7 | 0.5207415223107775 | 0.4825459113005001 | 0.39338080327355524 |
| 1.8 | 0.44077248717709766 | 0.41424295647459336 | 0.34799506017558246 |
B. Why amplitude peaks at resonance (energy transfer)
The driving force supplies energy each cycle.
Near resonance, the energy transfer adds up efficiently, so amplitude grows until the average power input equals the average power dissipated by damping.
C. Useful vs dangerous resonance (examples)
Useful:
- sound production in musical instruments (air columns/strings)
- tuning circuits (selecting a frequency)
Potentially dangerous:
- large vibrations in bridges/buildings if driven near a natural frequency
- damage in machines if rotating parts drive vibration near resonance
4. Common Mistakes
- Mixing up natural frequency with driving frequency (forced oscillation follows the driver).
- Saying “resonance always bad” (it depends on context; it can be useful or harmful).
- Forgetting damping limits the amplitude.
5. Exam Tips
- If asked about the effect of damping on the response curve: “lower peak and broader curve”.
- If asked how to reduce resonance effects: increase damping or change the natural frequency (e.g. change mass/stiffness).
6. Worked Examples
Modelled example 1
Identify resonance from a graph
Problem
Study the worked solution
Locate resonance
Method
The observed resonance frequency is about 8.0 Hz.Reason
Resonance is identified by the maximum steady amplitude.Working
Response peak at f_d = 8.0 Hz.Infer the natural frequency
Method
The natural frequency is close to 8.0 Hz.Reason
The response is largest when driving and natural frequencies are close.Working
f₀ ≈ 8.0 Hz.Limit the claim
Method
Do not claim exact equality from the graph alone.Reason
Damping can shift the response maximum slightly below the undamped natural frequency.Working
Inference: close to, not necessarily exactly, 8.0 Hz.
Guided practice 2
Qualitative damping comparison
Problem
Try this before viewing the solution
Hints
Hint 1: use both visual features
View solution step by step
Use peak height
Method
System A is more lightly damped.Reason
Less energy is dissipated per cycle, allowing a larger resonant response.Working
Higher peak ⇒ lighter damping.Use peak sharpness
Method
The narrower peak confirms the classification.Reason
Light damping gives stronger frequency selectivity.Working
Sharper peak ⇒ lighter damping.
Common misconception 3
Resonant driving frequency
Learner claim
Try this before viewing the solution
View solution step by step
State the resonance condition
Method
The largest response occurs when f_d is close to f₀.Reason
Near this condition, the driver transfers energy efficiently each cycle.Working
f_d ≈ f₀ ≈ 15 HzApply the damping caveat
Method
Exact equality is not guaranteed.Reason
Damping can shift the amplitude maximum slightly below the undamped natural frequency.Working
Use “approximately 15 Hz” unless a model specifies otherwise.
Examiner practice 4
Interpreting “broader peak” (band of frequencies)
Examination question
Try this before viewing the solution
View solution step by step
Identify the wider response
1 markMethod
System B responds over a wider frequency band.Reason
Greater damping broadens the resonance response.Working
Wider band: system B.Compare peak height
1 markMethod
System B has the lower maximum amplitude.Reason
More input energy is dissipated, limiting the resonant response.Working
Greater damping ⇒ lower peak.Compare curve width
1 markMethod
System B’s curve is broader and less sharp.Reason
The response is less frequency-selective.Working
Greater damping ⇒ broader peak.
Self-mark with the mark scheme
Compare your response with each mark point. Select a point only when your response contains that evidence.
Self-mark the system choice, peak height and width.
Challenge 5
Reducing dangerous resonance
Independent transfer
Try this before viewing the solution
Hints
Hint 1: change dissipation or detune
View solution step by step
Increase damping
Method
Add suitable dampers or another energy-dissipation mechanism.Reason
Greater damping lowers the resonance peak and limits steady amplitude.Working
Control 1: increase damping.Shift the natural frequency
Method
Change stiffness or mass distribution to move f₀ away from the dominant driving frequency.Reason
Detuning prevents the wind forcing from remaining close to the response maximum.Working
Control 2: change structural f₀.
7. Mind Stretchers
Mind stretcher 1: Why “sharpness” matters (selectivity)Extension
Explain why light damping can be useful for tuning (e.g. selecting one frequency) but risky for structures.
Show Answer
Light damping gives a sharp response peak: the system responds strongly to a narrow range of frequencies (useful for tuning/selectivity). But it also means if the driving frequency matches the natural frequency, the amplitude can become very large, which can be dangerous in structures.
Mind stretcher 2: Where does the energy go at steady state?Extension
At resonance, the amplitude reaches a steady value (it stops increasing). Explain what must be true about power input and power dissipated, and where the dissipated energy goes.
Show Answer
At steady state, the average power input from the driving force equals the average power dissipated by damping.
The dissipated energy is transferred mainly to internal energy (heating) of the oscillator and the surroundings, and sometimes to sound.
Mind stretcher 3: Optional (Enrichment)Extension
A. Videos (optional intuition)
Continue with the next resource in this course.
Course and syllabus information
- Course
- GCE A-Level H2 Physics
- Edition
- GCE A-Level H2 Physics 2027