Graphs and data analysis
Key idea: A best-fit line or curve shows the trend in measured data. Find gradients using widely separated points on the line, and use the gradient and intercept to interpret the relationship.
Offline pages
Saved on this device only. Connect at least once every 30 days to confirm Premium. Sign-out or a change of account removes saved copies.
Loading guide controls…
Guided lessons · coming soon
Guided lesson
Guided steps
- Check the valid timings and square the unrounded period.
- Find the mean, period and squared period with the stated rounding.
- Read the axes, plotted values, fitted line and gradient triangle.
- Find rise over run using two points on the line.
- Read each quantity from the correct graph axis.
- Find the gradient and intercept, then judge direct proportionality.
- Plot the points and compare your axes, line and triangle.
On this page
You stopped at:
ContinueA table of numbers hides the pattern in an experiment; a graph shows it at a glance. A best-fit line through the points evens out small reading errors, and its gradient and intercept tell you how the quantities are related. The pendulum readings from measuring and recording practical data show how to process the readings, plot them, find a gradient and state a conclusion the data support.
Process the readings
Each valid elapsed time is for 20 complete oscillations, so divide the mean elapsed time by 20 to find the period T, then square the unrounded period.
In the constructed example, the observer confirmed that the 26.9 s timing at 0.500 m counted only 19 oscillations. It remains in the raw-data record with that note; it is excluded from the mean of valid 20-oscillation timings. A third, correctly counted run gave 28.2 s. A point being inconvenient for a graph is never enough reason to remove it.
The processed table uses the valid timings. A dash means no third reading was supplied, not a zero time.
| l / m | t₁ / s | t₂ / s | t₃ / s | mean t / s | T / s | T² / s² |
|---|---|---|---|---|---|---|
| 0.200 | 18.0 | 17.8 | — | 17.9 | 0.895 | 0.801 |
| 0.300 | 22.0 | 21.8 | — | 21.9 | 1.10 | 1.20 |
| 0.400 | 25.3 | 25.5 | — | 25.4 | 1.27 | 1.61 |
| 0.500 | 28.4 | 26.9 | 28.2 | 28.3 | 1.42 | 2.00 |
| 0.600 | 31.1 | 30.9 | — | 31.0 | 1.55 | 2.40 |
| 0.700 | 33.5 | 33.7 | — | 33.6 | 1.68 | 2.82 |
T² is worked out from the unrounded period. For 0.300 m, T = 21.9 ÷ 20 = 1.095 s and T² = 1.199 ≈ 1.20 s². Squaring the rounded 1.10 would give 1.21 instead.
Check your understanding 1 Process the valid timings
For the 0.500 m row, use the two valid 20-oscillation timings, 28.4 s and 28.2 s. Find their mean to 1 decimal place and the period to 4 significant figures. Square the unrounded period and give T² to 3 significant figures.
Show the steps Optional working
Show the steps Optional working
Show the steps Optional working
Show answer
Mean time = (28.4 + 28.2)/2 = 28.3 s. Period = 28.3/20 = 1.415 s. Squaring gives 2.002225 s², which is 2.00 s² to 3 significant figures. The confirmed 19-oscillation timing is excluded from this mean. Squaring the prematurely rounded 1.42 s would give 2.02 s² instead.
Plot a graph and read it
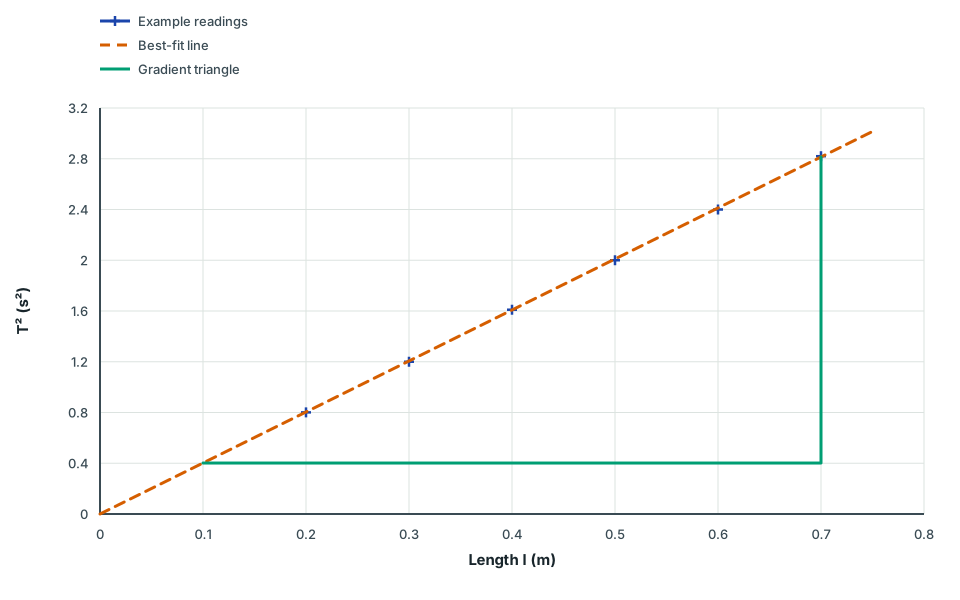
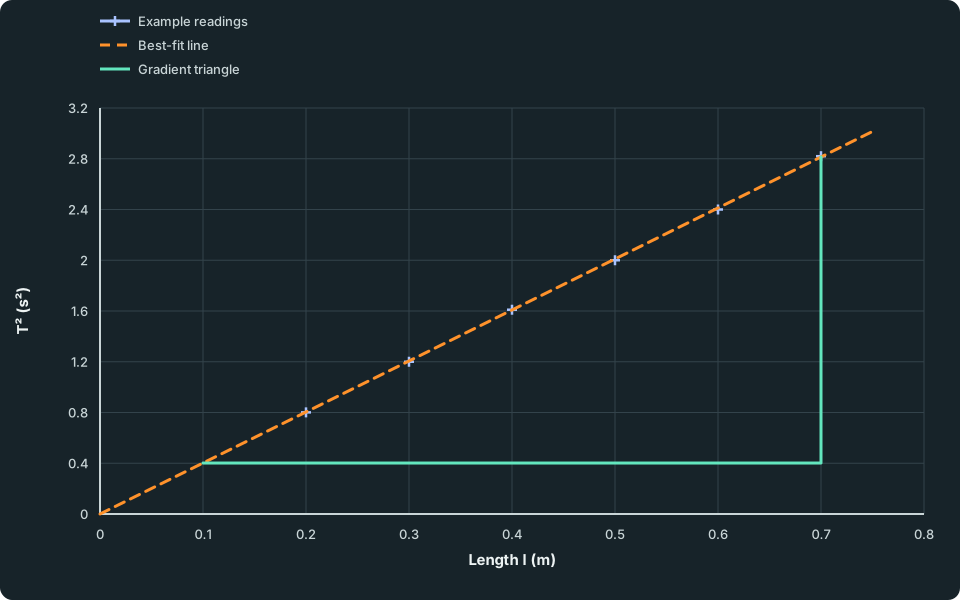
Exam questions usually tell you which graph to plot. For these example readings, plotting T² against l gives an approximately straight pattern.
- Put the quantity you changed (l) on the horizontal axis unless the question says otherwise.
- Label each axis with the quantity and unit.
- Choose a simple scale (1, 2 or 5 units per large square, or those times a power of ten) so that the points fill more than half the grid in each direction.
- Plot each point as a small, sharp cross.
- If the pattern is straight, draw one best-fit line with points roughly balanced on both sides. Do not join the dots or automatically force the fit through the origin. Use a smooth curve when the data indicate a curved relationship.
Period squared against pendulum length
Period squared T² in s² plotted against pendulum length l in m. Six example points from 0.200 m to 0.700 m lie close to a straight line through the origin. The gradient triangle runs horizontally from l = 0.10 m to 0.70 m at T² = 0.402 s², then vertically to T² = 2.814 s². The table lists each plotted coordinate.
Scroll across the figure to read all labels.
View figure data
| Series | Length l (m) | T² (s²) |
|---|---|---|
| Example readings | 0.20 | 0.801 |
| Example readings | 0.30 | 1.200 |
| Example readings | 0.40 | 1.610 |
| Example readings | 0.50 | 2.000 |
| Example readings | 0.60 | 2.400 |
| Example readings | 0.70 | 2.820 |
| Best-fit line | 0.00 | 0.000 |
| Best-fit line | 0.75 | 3.015 |
| Gradient triangle | 0.10 | 0.402 |
| Gradient triangle | 0.70 | 0.402 |
| Gradient triangle | 0.70 | 2.814 |
The example points are close to a straight line through the origin, so they are consistent with T² being directly proportional to l over the lengths tested. The drawn fit has a gradient of about 4.02 s²/m. The right-angled triangle shows its rise and run; its corners are points on the line, not additional readings.
A straight line with a non-zero intercept does not show direct proportionality. Check whether an offset is supported by the data instead of moving the line to the origin. A short range or scattered readings also limits how confidently you can describe the relationship.
To find the gradient, draw a large right-angled triangle on the line, using at least half of its length. Read two points on the line, not data points.
Worked example 1
Gradient of the pendulum graph
Problem
Use the best-fit line of the T² against l graph to find its gradient, with its unit.
Show full solution
Choose two far-apart points on the line
Method
Read (0.10 m, 0.40 s²) first. The second point is (0.70 m, 2.81 s²).
Reason
A large triangle makes the small errors in reading the graph a small fraction of each side.
Working
Answer
These are approximate readings from the drawn line; keep the same axis order in both coordinate pairs.
Divide the rise by the run
Method
Subtract in the same order for both axes and keep the units.Reason
Gradient is the change in the vertical quantity per unit change in the horizontal quantity.Working
Answer
gradient = (2.81 - 0.40)/(0.70 - 0.10) = (2.41 s²)/(0.60 m) = 4.02 s²/m
Quick check
You can also read values from the line. Answer these from the graph.
Check your understanding 2 Read two different quantities from the graph
Show answer
At 0.450 m, read about 1.81 s² from the line. For a period of 1.00 s, first square it: T² = 1.00 s². Read across to the line and down to about 0.249 m. The second horizontal value is a length, not a time; each answer uses the graph’s actual axes.
Anomalous points. If one point lies clearly off an otherwise good line, check its raw readings and repeat it if you can. Retain the raw reading and plotted point. Explain any decision to exclude it using the method and further evidence, not simply because it lies away from your preferred line. Without enough evidence, describe the uncertainty and investigate further.
Check your understanding 3 Construct and interpret a different fitted line
A best-fit line passes through (x,t) = (0.10 m,0.70 s) and (0.70 m,1.90 s). Calculate its gradient and vertical intercept. Is elapsed time directly proportional to length?
Show the steps Optional working
Show the steps Optional working
Show answer
The gradient is (1.90-0.70)/(0.70-0.10) = 2.0 s/m. The intercept is 0.70-2.0 × 0.10 = 0.50 s. A non-zero intercept means this is not direct proportionality. Dividing 1.90 s by 0.70 m includes the intercept; a gradient uses changes between two points.
Check your understanding 4 Draw a line with an intercept
Plot the two supplied points on paper, with x from 0 to 0.80 m. Draw their straight line and a large gradient triangle. Compare the axes, intercept and triangle with the model criteria.
Show answer
Label the horizontal axis x / m and the vertical axis t / s. Plot (0.10, 0.70) and (0.70, 1.90) and draw one straight line through them. It crosses the vertical axis at 0.50 s. A triangle between those two points has rise 1.20 s and run 0.60 m; use at least half the line’s length.
Common mistakes
- Rounding the period before squaring it.
- Joining the dots instead of drawing one best-fit line or smooth curve.
- Finding a gradient from a small triangle, or from data points instead of points on the line.
- Leaving out the gradient’s unit: the vertical-axis unit divided by the horizontal-axis unit.
- Forcing the line through the origin when the data do not support it.
- Removing a point only because it is off the line, without evidence from the method.
Spotted an error? Report a correction
Syllabus and review details
- SEC G2 Science Physics component 2027 · 2027
Physics section, PDF pages 8–23
Last reviewed: