G2 practical skills and investigations
Key idea: Measure reliably and prepare for the six practical-work groups: measurement, density, free fall, forces, thermal transfer and resistance.
Continue where you stopped
The core idea
G2 Science Physics · Practical skills · about 45 min
A strong practical answer explains what you change, what you measure and how you make the comparison fair. This lesson builds those habits through the six groups of practical work named for G2 Science Physics.
What you will be able to do
- choose and use the listed instruments for length, time, volume, mass, weight, temperature, current and voltage;
- determine density, acceleration of free fall and the resistance of a component;
- investigate balanced and unbalanced forces and factors affecting thermal transfer;
- record results, use graphs, discuss limitations and suggest specific improvements.
1. Measure reliably
Start by naming the quantity. Then choose an instrument whose range covers the expected value and whose resolution is fine enough to show useful changes. More decimal places do not automatically make a reading accurate.
| Quantity | Instrument | Good technique |
|---|---|---|
| Length | Tape, rule, digital calipers or digital micrometer | Match the instrument to the size; check zero and avoid tilting it. |
| Time interval | Digital stopwatch | Use clear start and stop events. For a pendulum, time many oscillations and divide. |
| Volume | Measuring cylinder | Keep it upright and read the bottom of a water meniscus at eye level. |
| Mass | Electronic balance | Zero the balance; keep the sample dry and centred. |
| Weight | Spring balance | Check zero and align the pull with the scale. |
| Temperature | Laboratory thermometer | Immerse the bulb without touching the container and wait for a steady reading. |
| Current | Ammeter | Connect in series and begin with a suitable range. |
| Voltage | Voltmeter | Connect in parallel across the component or points being compared. |
- Check.Inspect the apparatus, check zero and choose a suitable range.
- Position.Align the instrument correctly and view analogue scales straight on.
- Record.Put the unit in the table heading and keep decimal places consistent with the instrument.
- Repeat.Take repeat readings when values vary. Investigate an anomalous value before deciding whether to exclude it.
Check your understanding
A pendulum completes 20 oscillations in 31.6 s, 31.8 s and 31.7 s. Find its period.
Show the guided answer
The mean time for 20 oscillations is 31.7 s. Period = 31.7/20 = 1.585 s, or 1.59 s to three significant figures. Timing many oscillations reduces the percentage effect of reaction time.
2. Determine density
Density compares mass with the volume occupied:
density = mass ÷ volume
Liquid
- Find the mass of an empty, dry container.
- Add a measured volume of liquid and find the new mass.
- Subtract to obtain the liquid’s mass, then divide by its volume.
Regular solid
- Measure mass with an electronic balance.
- Measure the needed dimensions and calculate volume.
- Use repeated dimension readings if the shape is not perfectly uniform.
Irregular solid that sinks
- Record the initial water volume, V1.
- Submerge the object fully and record V2.
- Object volume = V2 − V1.
Worked example: an irregular metal piece
Mass = 63.0 g. Water rises from 38.0 cm³ to 46.0 cm³.
Volume = 46.0 − 38.0 = 8.0 cm³.
Density = 63.0/8.0 = 7.9 g/cm³ to two significant figures.
3. Determine the acceleration of free fall
A freely falling object released from rest has approximately constant acceleration near Earth’s surface. Electronic timing is useful because a short fall is difficult to time reliably by hand.
An electronic release-and-light-gate method
- Clamp the release mechanism securely and measure the vertical distance s from the release point to the timing point.
- Connect the release mechanism so releasing the object starts the electronic timer; the object passing through the light gate stops it. This gives the fall time t without hand-timing.
- Repeat at each distance and calculate a mean time. Use several well-spaced distances.
- Calculate t2 and plot s against t2.
- Since s = ½gt2, gradient = ½g, so g = 2 × gradient.
Why several data points?
A line of best fit uses all the evidence, reduces the influence of one uncertain time and reveals whether the model is sensible. One value of s/t is average speed, not acceleration.
Check your understanding
A graph of s against t2 has gradient 4.8 m/s². Determine g.
Check your answer
g = 2 × gradient = 2 × 4.8 = 9.6 m/s².
4. Investigate balanced and unbalanced forces
Opposite forces are balanced only when their magnitudes are equal. Balanced forces give zero resultant force and zero acceleration; the object may be at rest or moving at constant velocity.
A trolley investigation
- Use a trolley on the same level track and keep its total mass constant.
- Measure the applied force with a force sensor or spring balance. Account for resistance when finding the resultant force.
- Use a motion sensor or light gates to measure the trolley’s change in velocity and acceleration.
- Start with forces that balance, then change one force to produce several unbalanced resultants.
- Repeat each setting and compare acceleration with resultant force.
Independent variableresultant force
Dependent variableacceleration or change in velocity
Control variablestrolley mass, track and starting method
Check your understanding
A trolley moves at constant velocity while the driving force is 1.8 N. What is the resistive force?
Check your answer
Constant velocity means zero acceleration and zero resultant force, so the resistive force is 1.8 N in the opposite direction.
5. Investigate factors affecting thermal transfer
Choose one factor, such as insulation material, insulation thickness or surface finish. Change only that factor so the temperature–time evidence supports a fair comparison.
Example: compare insulating materials
- Wrap identical containers with equal thicknesses of two materials. Include an unwrapped container if a control is useful.
- Add the same mass of water at the same starting temperature to each container.
- Use identical lids, thermometers and container geometry. Keep them in the same surroundings.
- Record temperature at equal time intervals for the same total time.
- Repeat, then compare temperature drop or the gradients of temperature–time curves.
Independent variableinsulation material
Dependent variabletemperature change or cooling rate
Control variableswater mass, start temperature, container, thickness, lid and surroundings
Worked comparison
In 10 min, cup A cools from 70 °C to 57 °C and cup B cools from 70 °C to 62 °C.
Cup A falls by 13 °C; cup B falls by 8 °C. Under the matched conditions, B is the better insulator because the rate of energy transfer from the water is lower.
6. Determine the resistance of a component
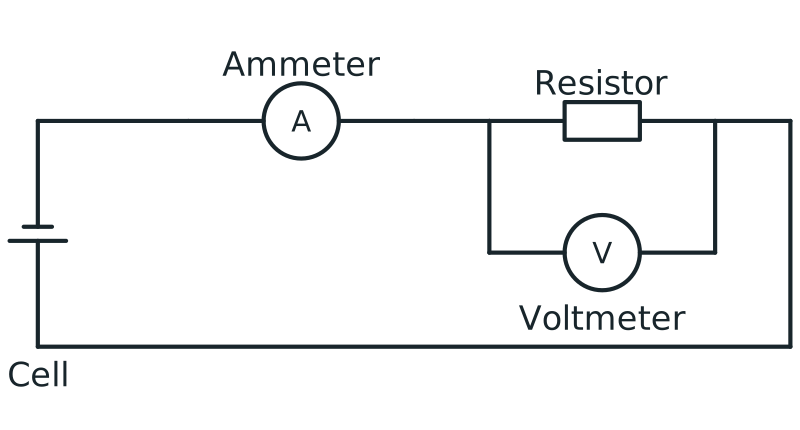
Voltmeter connection in parallel
Circuit with ammeter in series and voltmeter connected in parallel across a resistor to measure potential difference.
View figure data
| Part | Connection |
|---|---|
| Ammeter | In series in the main loop |
| Voltmeter | In parallel across the resistor |
| Resistor | In the conducting loop with the cell and ammeter |
R = V ÷ I
- Connect the ammeter in series with the component and the voltmeter in parallel across it.
- Ask for the circuit to be checked before switching on. Begin with a low supply setting.
- Record a paired potential difference V and current I.
- Change the supply safely and collect several paired readings. Switch off between readings if heating would change the resistance.
- Calculate R = V/I for each pair, or use a suitable graph if asked.
Worked example
A resistor has 3.6 V across it and current 0.24 A through it.
R = 3.6/0.24 = 15 Ω.
Check: both readings describe the same component at the same time.
7. Practise this
- Explain: choose one investigation and describe the apparatus, independent variable, dependent variable and two control variables.
- Apply: sketch a results table with every heading written as quantity / unit.
- Evaluate: name one important limitation, explain its effect on the result and give a specific improvement.
- Check: return to the three opening questions and answer each one in a full sentence.
Compare your plan with a strong example
To compare two insulating materials, wrap identical containers with the same thickness of each material. Add the same mass of water at the same starting temperature, fit identical lids and place both containers in the same surroundings. The material is the independent variable; temperature change after a fixed time is the dependent variable. Water mass, starting temperature, container, insulation thickness and timing intervals are controlled.
A suitable table has columns headed time / min, temperature of A / °C and temperature of B / °C. Repeat the comparison and plot both temperature–time curves. The material with the smaller temperature fall or gentler cooling gradient is the better insulator under the controlled conditions.
One limitation is energy transfer through the lid, thermometer and exposed parts of the container. This reduces how completely the result represents the insulation alone. Use identical fitted lids, expose the same area in both setups and repeat after swapping the materials between the containers to check whether the containers themselves affect the result.
For a theory-paper practical question
Use observable steps. Name the apparatus, say exactly what is measured, show how the comparison is kept fair, repeat readings and explain how the result answers the question. The syllabus does not require a memorised full procedure, so reason from the quantities and apparatus given.
Continue with the next resource in this course.
Course and syllabus information
- Course
- SEC G2 Science Physics component
- Edition
- SEC G2 Science Physics component 2027