General properties of waves
Key idea: Connect wave motion and quantities to sound production, pitch, loudness and echo ranging.
Continue where you stopped
The core idea
On this page
Learning objectives
- Describe wave generation by vibrating sources, ropes and springs
- Describe ripple-tank waves using wavefronts
- Explain that waves transfer energy
- Explain that wave energy transfer does not transfer matter
- Use amplitude, frequency and wavelength to describe wave motion
- Define and use wave speed and period and interpret wave graphs
- Recall and apply wave speed = frequency × wavelength
- Compare transverse and longitudinal waves and give examples
- Explain sound production by vibration and the need for a medium
- Describe sound using compressions and rarefactions
- Relate sound loudness to amplitude and pitch to frequency
- Explain reflected-sound echoes and use them to measure distance
Wave motion and quantities
Wave motion, wavefronts and energy transfer
A vibrating source produces a disturbance. The disturbance travels and transfers energy, while particles of the medium oscillate about equilibrium: there is no net transfer of matter with the wave.
Imagine a coloured mark on a stretched rope. Shake one end up and down: the disturbance moves along the rope, but the mark moves up and down near its original position. Each part pulls on its neighbour, passing on energy. The travelling crest is a pattern of displacement, not one piece of rope travelling from the source to the far end. This ideal travelling-wave model describes oscillation without a steady flow of the medium.
These ripple-tank views are snapshots from above. Each drawn line joins points at the same phase, such as neighbouring parts of one crest. Successive crest lines are one wavelength apart. Energy travels across the lines, perpendicular to them: away from the bar for straight wavefronts and radially outwards from the point source for circular ones. The drawn arrows describe propagation, not the path of a water particle.
Try first: a crest passes a floating marker. Must the marker travel with it
to the far end of the tank?
No. In the taught wave model the marker oscillates locally as successive crests pass. Energy reaches new positions while the medium has no net transport with the wave. Saying “nothing moves” is also wrong: the local oscillation is what passes the disturbance on.
Wave quantities, frequency and period
- Amplitude
- Maximum displacement from equilibrium.
- Wavelength, λ
- Shortest distance between two points in phase.
- Frequency, f
- Number of complete oscillations each second, in hertz.
- Period, T
- Time for one complete oscillation, with T = 1/f.
Read the axes before choosing an interval
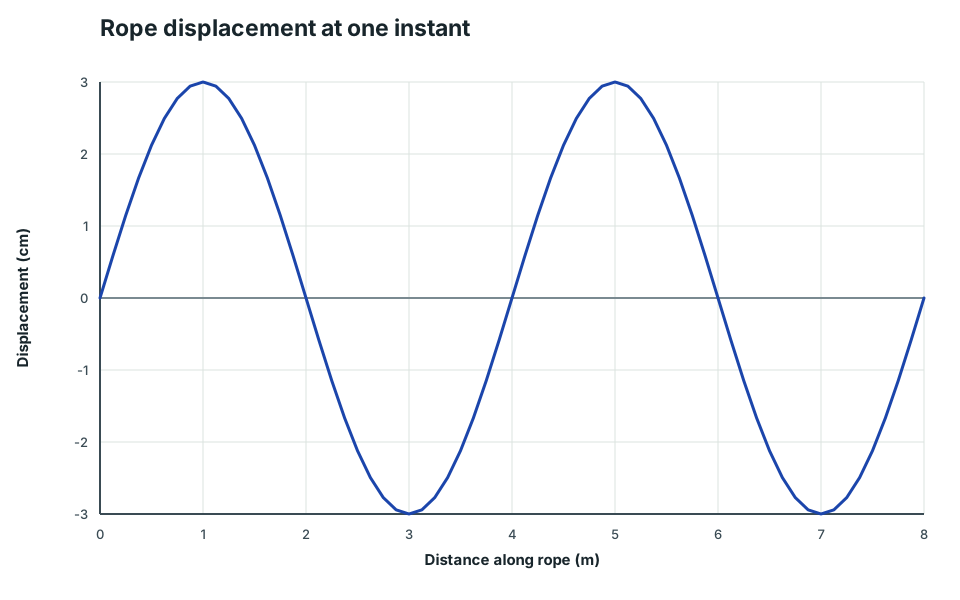
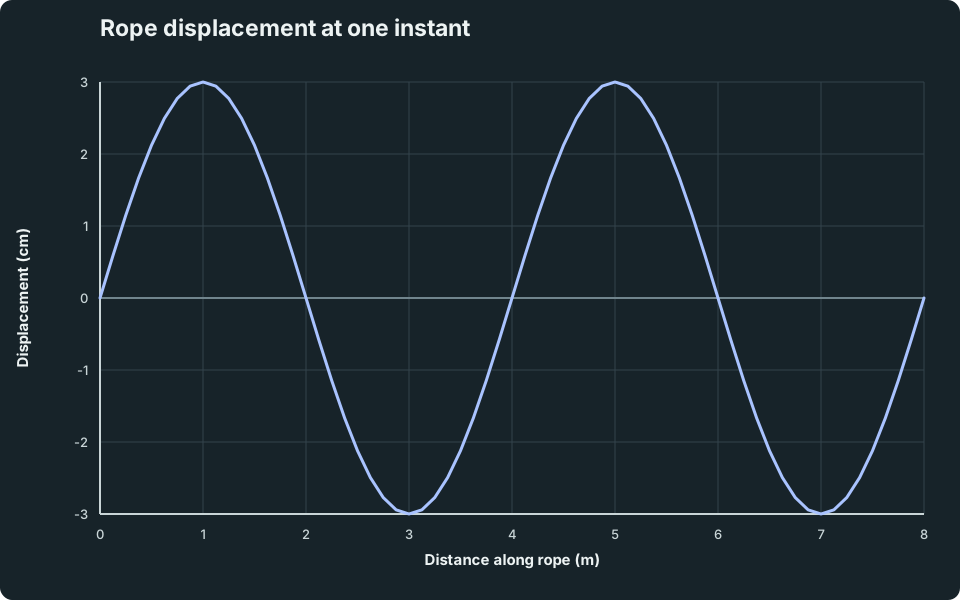
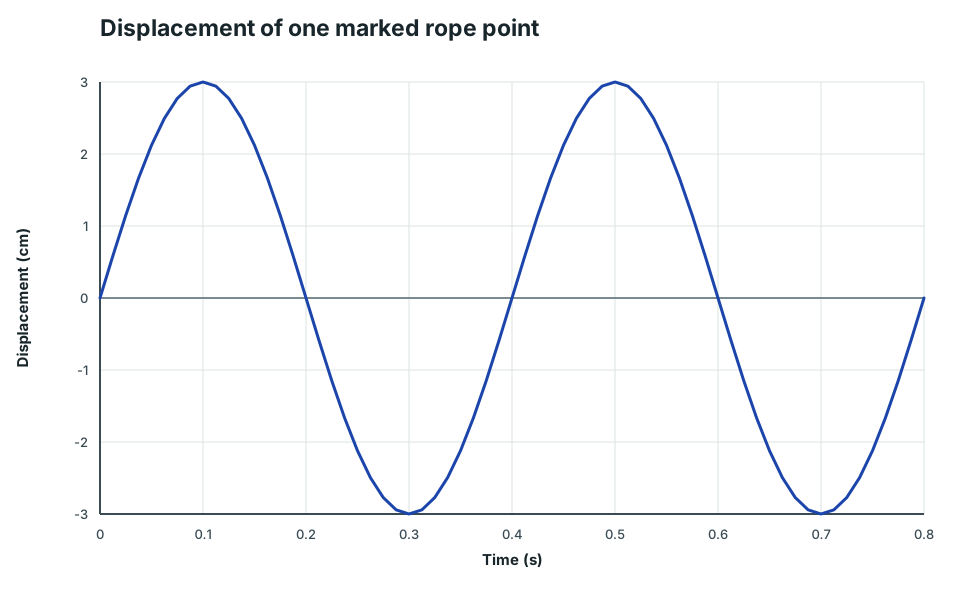
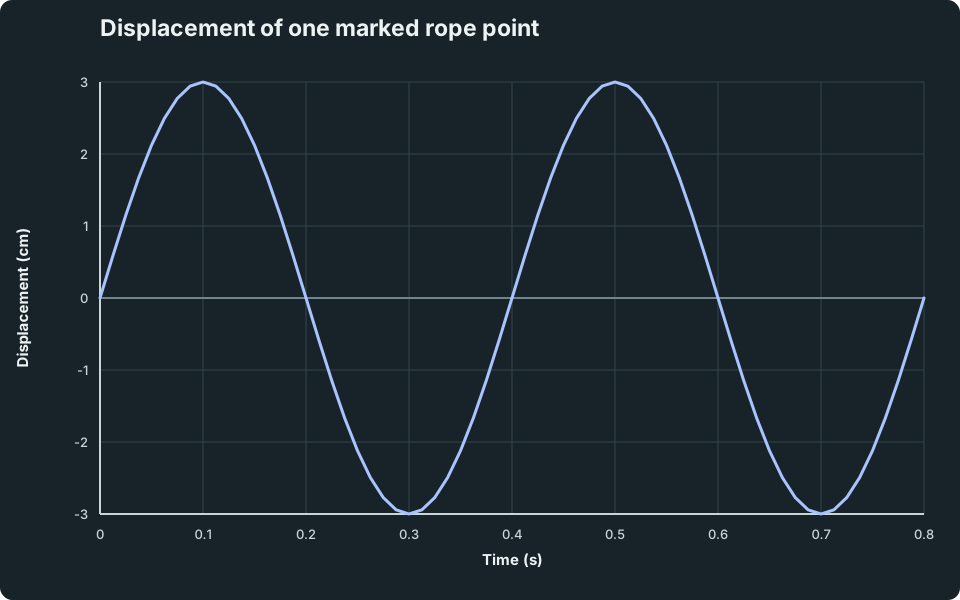
A displacement–distance graph is a snapshot of many points at one instant. Its horizontal axis tells you where a point is. A displacement–time graph follows one fixed point as time passes. The curves can look alike, but a horizontal interval has a different meaning on each one. On either graph, read amplitude vertically from zero displacement to a peak, not from trough to crest.
Rope displacement at one instant
A snapshot at t = 0 s; the wave travels towards increasing distance.
Scroll across the graph to read all labels.
View figure data
| Distance along rope (m) | Rope |
|---|---|
| 0 | 0 |
| 0.125 | 0.585271 |
| 0.25 | 1.14805 |
| 0.375 | 1.666711 |
| 0.5 | 2.12132 |
| 0.625 | 2.494409 |
| 0.75 | 2.771639 |
| 0.875 | 2.942356 |
| 1 | 3 |
| 1.125 | 2.942356 |
| 1.25 | 2.771639 |
| 1.375 | 2.494409 |
| 1.5 | 2.12132 |
| 1.625 | 1.666711 |
| 1.75 | 1.14805 |
| 1.875 | 0.585271 |
| 2 | 0 |
| 2.125 | -0.585271 |
| 2.25 | -1.14805 |
| 2.375 | -1.666711 |
| 2.5 | -2.12132 |
| 2.625 | -2.494409 |
| 2.75 | -2.771639 |
| 2.875 | -2.942356 |
| 3 | -3 |
| 3.125 | -2.942356 |
| 3.25 | -2.771639 |
| 3.375 | -2.494409 |
| 3.5 | -2.12132 |
| 3.625 | -1.666711 |
| 3.75 | -1.14805 |
| 3.875 | -0.585271 |
| 4 | 0 |
| 4.125 | 0.585271 |
| 4.25 | 1.14805 |
| 4.375 | 1.666711 |
| 4.5 | 2.12132 |
| 4.625 | 2.494409 |
| 4.75 | 2.771639 |
| 4.875 | 2.942356 |
| 5 | 3 |
| 5.125 | 2.942356 |
| 5.25 | 2.771639 |
| 5.375 | 2.494409 |
| 5.5 | 2.12132 |
| 5.625 | 1.666711 |
| 5.75 | 1.14805 |
| 5.875 | 0.585271 |
| 6 | 0 |
| 6.125 | -0.585271 |
| 6.25 | -1.14805 |
| 6.375 | -1.666711 |
| 6.5 | -2.12132 |
| 6.625 | -2.494409 |
| 6.75 | -2.771639 |
| 6.875 | -2.942356 |
| 7 | -3 |
| 7.125 | -2.942356 |
| 7.25 | -2.771639 |
| 7.375 | -2.494409 |
| 7.5 | -2.12132 |
| 7.625 | -1.666711 |
| 7.75 | -1.14805 |
| 7.875 | -0.585271 |
| 8 | 0 |
In this snapshot, the crest at 1 m and the next crest at 5 m are at equivalent phases. Their separation is 5 − 1 = 4 m, so the wavelength is 4 m. The trough at 3 m is only halfway through that cycle: crest-to-trough gives half a wavelength. The peak displacement is 3 cm, so the amplitude is 3 cm even though the full crest-to-trough height is 6 cm.
Displacement of one marked rope point
The record of a fixed point during the same steady travelling wave.
Scroll across the graph to read all labels.
View figure data
| Time (s) | Marked point |
|---|---|
| 0 | 0 |
| 0.0125 | 0.585271 |
| 0.025 | 1.14805 |
| 0.0375 | 1.666711 |
| 0.05 | 2.12132 |
| 0.0625 | 2.494409 |
| 0.075 | 2.771639 |
| 0.0875 | 2.942356 |
| 0.1 | 3 |
| 0.1125 | 2.942356 |
| 0.125 | 2.771639 |
| 0.1375 | 2.494409 |
| 0.15 | 2.12132 |
| 0.1625 | 1.666711 |
| 0.175 | 1.14805 |
| 0.1875 | 0.585271 |
| 0.2 | 0 |
| 0.2125 | -0.585271 |
| 0.225 | -1.14805 |
| 0.2375 | -1.666711 |
| 0.25 | -2.12132 |
| 0.2625 | -2.494409 |
| 0.275 | -2.771639 |
| 0.2875 | -2.942356 |
| 0.3 | -3 |
| 0.3125 | -2.942356 |
| 0.325 | -2.771639 |
| 0.3375 | -2.494409 |
| 0.35 | -2.12132 |
| 0.3625 | -1.666711 |
| 0.375 | -1.14805 |
| 0.3875 | -0.585271 |
| 0.4 | 0 |
| 0.4125 | 0.585271 |
| 0.425 | 1.14805 |
| 0.4375 | 1.666711 |
| 0.45 | 2.12132 |
| 0.4625 | 2.494409 |
| 0.475 | 2.771639 |
| 0.4875 | 2.942356 |
| 0.5 | 3 |
| 0.5125 | 2.942356 |
| 0.525 | 2.771639 |
| 0.5375 | 2.494409 |
| 0.55 | 2.12132 |
| 0.5625 | 1.666711 |
| 0.575 | 1.14805 |
| 0.5875 | 0.585271 |
| 0.6 | 0 |
| 0.6125 | -0.585271 |
| 0.625 | -1.14805 |
| 0.6375 | -1.666711 |
| 0.65 | -2.12132 |
| 0.6625 | -2.494409 |
| 0.675 | -2.771639 |
| 0.6875 | -2.942356 |
| 0.7 | -3 |
| 0.7125 | -2.942356 |
| 0.725 | -2.771639 |
| 0.7375 | -2.494409 |
| 0.75 | -2.12132 |
| 0.7625 | -1.666711 |
| 0.775 | -1.14805 |
| 0.7875 | -0.585271 |
| 0.8 | 0 |
Now follow the marked point. Successive maxima occur at 0.10 s and 0.50 s, so one complete oscillation takes 0.40 s. This is the period, not a wavelength: the horizontal unit is seconds. Frequency counts complete cycles per second, so f = 1/T = 1/0.40 = 2.5 Hz. A longer period means fewer cycles per second.
Try first: a learner calls the 0.10 s to 0.30 s interval “one period” and
calculates 5 Hz. Which step fails first?
The chosen endpoints are a maximum and a minimum, not equivalent phases. That 0.20 s interval is half a cycle. Use maximum to next maximum, or a zero crossing to the next crossing in the same direction: T = 0.40 s and f = 2.5 Hz. Two successive zero crossings in opposite directions are also only half a cycle apart.
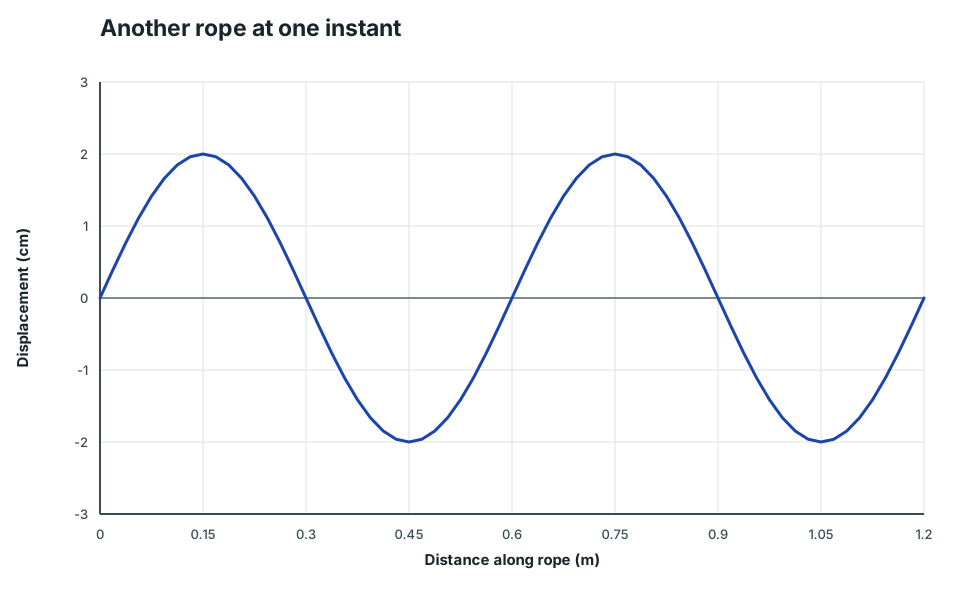
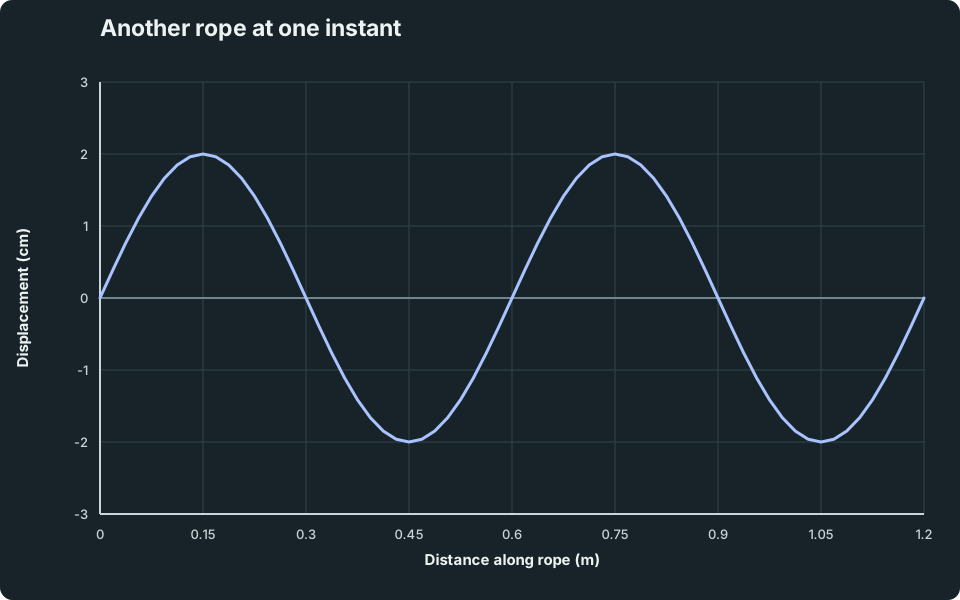
Another rope at one instant
Displacement observations at t = 0 s; the wave travels right.
Scroll across the graph to read all labels.
View figure data
| Distance along rope (m) | Rope |
|---|---|
| 0 | 0 |
| 0.01875 | 0.390181 |
| 0.0375 | 0.765367 |
| 0.05625 | 1.11114 |
| 0.075 | 1.414214 |
| 0.09375 | 1.662939 |
| 0.1125 | 1.847759 |
| 0.13125 | 1.961571 |
| 0.15 | 2 |
| 0.16875 | 1.961571 |
| 0.1875 | 1.847759 |
| 0.20625 | 1.662939 |
| 0.225 | 1.414214 |
| 0.24375 | 1.11114 |
| 0.2625 | 0.765367 |
| 0.28125 | 0.390181 |
| 0.3 | 0 |
| 0.31875 | -0.390181 |
| 0.3375 | -0.765367 |
| 0.35625 | -1.11114 |
| 0.375 | -1.414214 |
| 0.39375 | -1.662939 |
| 0.4125 | -1.847759 |
| 0.43125 | -1.961571 |
| 0.45 | -2 |
| 0.46875 | -1.961571 |
| 0.4875 | -1.847759 |
| 0.50625 | -1.662939 |
| 0.525 | -1.414214 |
| 0.54375 | -1.11114 |
| 0.5625 | -0.765367 |
| 0.58125 | -0.390181 |
| 0.6 | 0 |
| 0.61875 | 0.390181 |
| 0.6375 | 0.765367 |
| 0.65625 | 1.11114 |
| 0.675 | 1.414214 |
| 0.69375 | 1.662939 |
| 0.7125 | 1.847759 |
| 0.73125 | 1.961571 |
| 0.75 | 2 |
| 0.76875 | 1.961571 |
| 0.7875 | 1.847759 |
| 0.80625 | 1.662939 |
| 0.825 | 1.414214 |
| 0.84375 | 1.11114 |
| 0.8625 | 0.765367 |
| 0.88125 | 0.390181 |
| 0.9 | 0 |
| 0.91875 | -0.390181 |
| 0.9375 | -0.765367 |
| 0.95625 | -1.11114 |
| 0.975 | -1.414214 |
| 0.99375 | -1.662939 |
| 1.0125 | -1.847759 |
| 1.03125 | -1.961571 |
| 1.05 | -2 |
| 1.06875 | -1.961571 |
| 1.0875 | -1.847759 |
| 1.10625 | -1.662939 |
| 1.125 | -1.414214 |
| 1.14375 | -1.11114 |
| 1.1625 | -0.765367 |
| 1.18125 | -0.390181 |
| 1.2 | 0 |
Read this new snapshot before opening the feedback: give the amplitude and
wavelength, then decide whether the period can be obtained from this graph
alone.
Amplitude is 2 cm from equilibrium to a peak. Crests at 0.15 m and 0.75 m give a wavelength of 0.60 m. This single snapshot does not say how quickly the shape changes, so it cannot alone give a period or frequency. A time record, or speed information combined with the wavelength, is needed.
Wave speed and transverse/longitudinal models
Use
v = f λ
. Convert wavelength to metres before substitution and check that Hz × m gives m/s. For f = 5.0 Hz and λ = 0.40 m, the speed is 2.0 m/s.
In one period a crest advances one wavelength. Dividing that distance by the time gives v = λ/T; because f = 1/T, this is v = fλ. For the first pair of graphs, λ = 4 m and f = 2.5 Hz, giving v = 10 m/s. Do not multiply frequency by the 3 cm amplitude: amplitude describes local displacement, not the distance the pattern travels in one cycle.
Try first: the second rope snapshot is produced by a source oscillating at
5.0 Hz. Find the wave speed using the graph.
The wavelength read from the snapshot is 0.60 m, so v = 5.0 × 0.60 = 3.0 m/s. If using 60 cm, convert it to 0.60 m before reporting metres per second. The 2 cm amplitude is not needed.
Compare the two physical directions
In a transverse wave, vibration is perpendicular to travel. In a longitudinal wave, vibration is parallel to travel and produces compressions and rarefactions. Classify a wave from physical directions, not merely from a sinusoidal graph shape.
Try first: a rope wave travels right while a marked point oscillates
vertically. Which motion determines the wave type?
Compare the vertical particle oscillation with the horizontal propagation: they are perpendicular, so the wave is transverse. Reversing propagation would leave that classification unchanged. In the longitudinal model above, the particles move back and forth along the propagation direction; the compression pattern travels while each particle stays near its equilibrium position.
Sound and echo ranging
Sound production, loudness and pitch
A vibrating source pushes and pulls nearby particles. Those particles pass a pressure disturbance through a material medium, so sound cannot travel through a vacuum. In air, the vibration is parallel to travel and alternating high-pressure compressions and low-pressure rarefactions form.
When a loudspeaker cone moves out, it crowds the adjacent air into a compression. When it moves back, a rarefaction forms. Air particles interact with their neighbours, so these pressure changes travel away from the cone. The same air particles do not travel all the way from the speaker to your ear. Removing the air interrupts this mechanism even if the cone still vibrates; an empty gap provides no particles to pass on the disturbance.
Try first: a learner draws the sound wave as a sine curve and concludes that
air particles move up and down. What is the first error?
The curve may plot pressure against position or a microphone signal against time. Its vertical axis is not automatically a physical direction. In air, particle oscillation is parallel to sound propagation, so sound is longitudinal. Read the axes before interpreting a trace.
Loudness and pitch
For sounds compared at the same listening position under otherwise comparable conditions, greater amplitude normally means a louder sound. Greater frequency means a higher pitch. Changing amplitude alone does not change pitch, and frequency is not the amplitude measure used to compare loudness in this model.
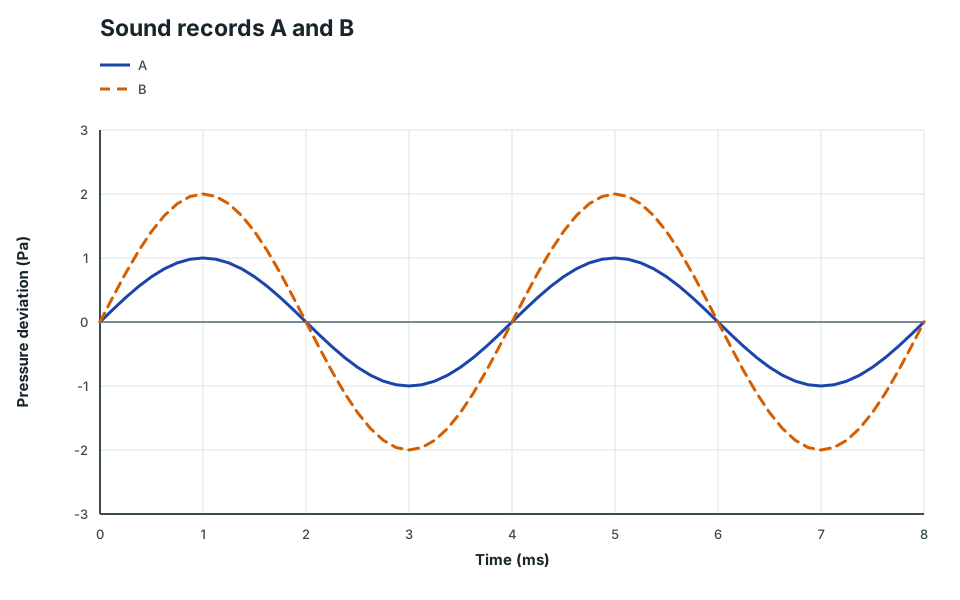
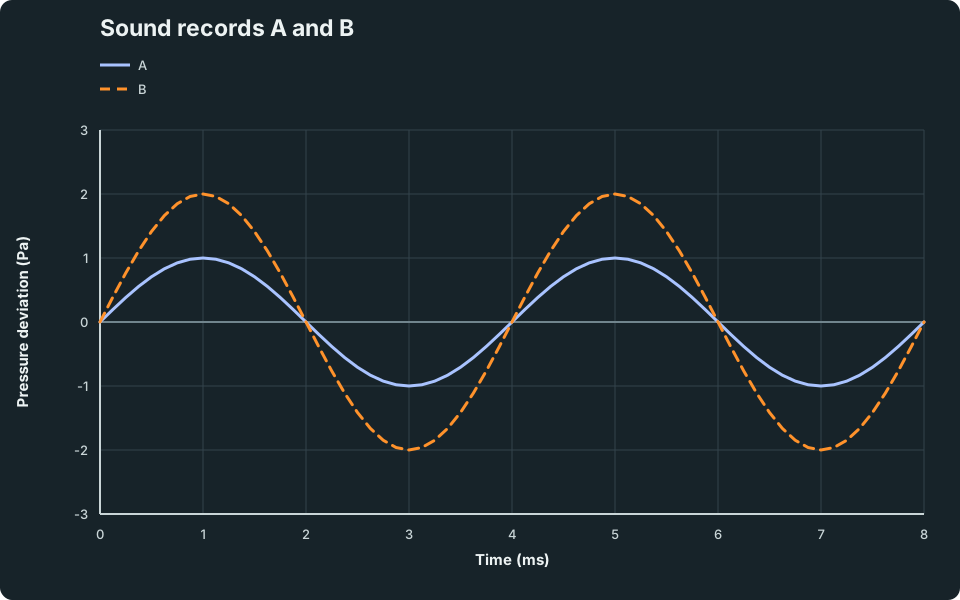
Sound records A and B
Pressure records at the same microphone position, with identical equipment and gain. Both records use the displayed time scale.
Scroll across the graph to read all labels.
View figure data
| Time (ms) | A | B |
|---|---|---|
| 0 | 0 | 0 |
| 0.125 | 0.19509 | 0.390181 |
| 0.25 | 0.382683 | 0.765367 |
| 0.375 | 0.55557 | 1.11114 |
| 0.5 | 0.707107 | 1.414214 |
| 0.625 | 0.83147 | 1.662939 |
| 0.75 | 0.92388 | 1.847759 |
| 0.875 | 0.980785 | 1.961571 |
| 1 | 1 | 2 |
| 1.125 | 0.980785 | 1.961571 |
| 1.25 | 0.92388 | 1.847759 |
| 1.375 | 0.83147 | 1.662939 |
| 1.5 | 0.707107 | 1.414214 |
| 1.625 | 0.55557 | 1.11114 |
| 1.75 | 0.382683 | 0.765367 |
| 1.875 | 0.19509 | 0.390181 |
| 2 | 0 | 0 |
| 2.125 | -0.19509 | -0.390181 |
| 2.25 | -0.382683 | -0.765367 |
| 2.375 | -0.55557 | -1.11114 |
| 2.5 | -0.707107 | -1.414214 |
| 2.625 | -0.83147 | -1.662939 |
| 2.75 | -0.92388 | -1.847759 |
| 2.875 | -0.980785 | -1.961571 |
| 3 | -1 | -2 |
| 3.125 | -0.980785 | -1.961571 |
| 3.25 | -0.92388 | -1.847759 |
| 3.375 | -0.83147 | -1.662939 |
| 3.5 | -0.707107 | -1.414214 |
| 3.625 | -0.55557 | -1.11114 |
| 3.75 | -0.382683 | -0.765367 |
| 3.875 | -0.19509 | -0.390181 |
| 4 | 0 | 0 |
| 4.125 | 0.19509 | 0.390181 |
| 4.25 | 0.382683 | 0.765367 |
| 4.375 | 0.55557 | 1.11114 |
| 4.5 | 0.707107 | 1.414214 |
| 4.625 | 0.83147 | 1.662939 |
| 4.75 | 0.92388 | 1.847759 |
| 4.875 | 0.980785 | 1.961571 |
| 5 | 1 | 2 |
| 5.125 | 0.980785 | 1.961571 |
| 5.25 | 0.92388 | 1.847759 |
| 5.375 | 0.83147 | 1.662939 |
| 5.5 | 0.707107 | 1.414214 |
| 5.625 | 0.55557 | 1.11114 |
| 5.75 | 0.382683 | 0.765367 |
| 5.875 | 0.19509 | 0.390181 |
| 6 | 0 | 0 |
| 6.125 | -0.19509 | -0.390181 |
| 6.25 | -0.382683 | -0.765367 |
| 6.375 | -0.55557 | -1.11114 |
| 6.5 | -0.707107 | -1.414214 |
| 6.625 | -0.83147 | -1.662939 |
| 6.75 | -0.92388 | -1.847759 |
| 6.875 | -0.980785 | -1.961571 |
| 7 | -1 | -2 |
| 7.125 | -0.980785 | -1.961571 |
| 7.25 | -0.92388 | -1.847759 |
| 7.375 | -0.83147 | -1.662939 |
| 7.5 | -0.707107 | -1.414214 |
| 7.625 | -0.55557 | -1.11114 |
| 7.75 | -0.382683 | -0.765367 |
| 7.875 | -0.19509 | -0.390181 |
| 8 | 0 | 0 |
The microphone records changes of pressure at one place; the graph does not show air particles moving vertically. A and B each complete two cycles in the same 8 ms window, giving a period of 4 ms = 0.004 s and frequency of 250 Hz. B has twice the pressure amplitude. Under these controlled conditions B is louder, while both have the same pitch. Counting cycles is useful only after checking that the time intervals are equal.
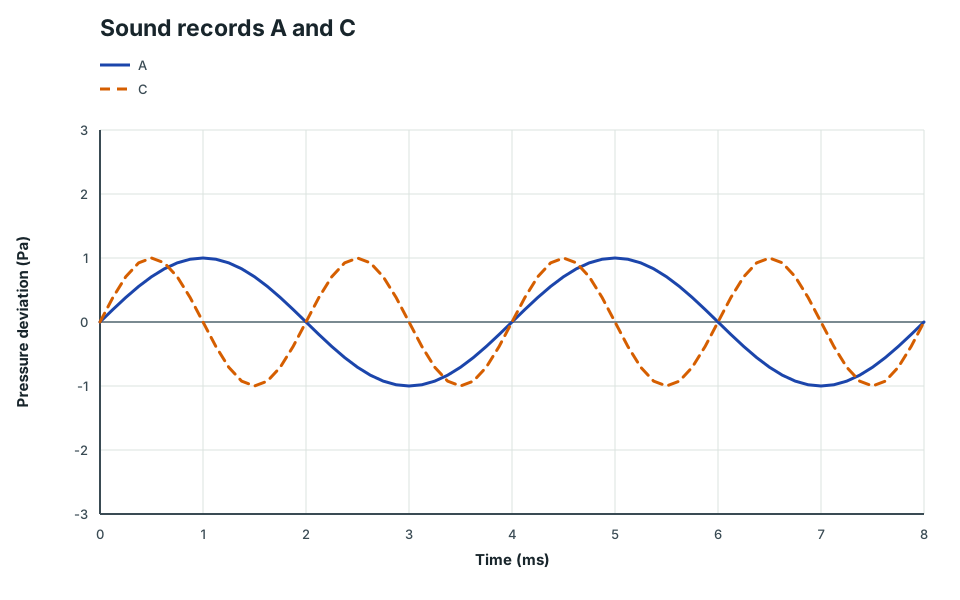
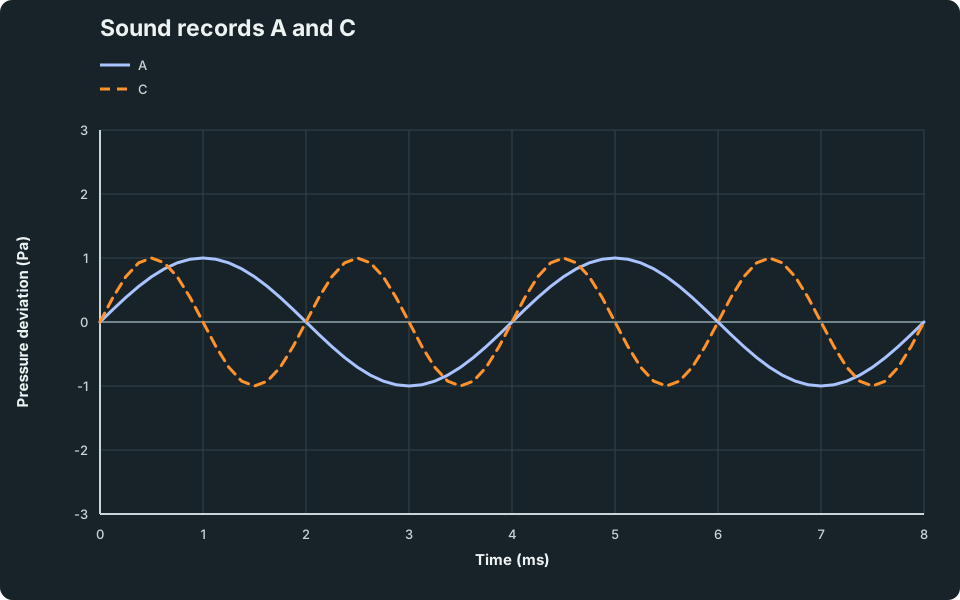
Sound records A and C
Pressure records at the same microphone position, with identical equipment and gain. Both records use the displayed time scale.
Scroll across the graph to read all labels.
View figure data
| Time (ms) | A | C |
|---|---|---|
| 0 | 0 | 0 |
| 0.125 | 0.19509 | 0.382683 |
| 0.25 | 0.382683 | 0.707107 |
| 0.375 | 0.55557 | 0.92388 |
| 0.5 | 0.707107 | 1 |
| 0.625 | 0.83147 | 0.92388 |
| 0.75 | 0.92388 | 0.707107 |
| 0.875 | 0.980785 | 0.382683 |
| 1 | 1 | 0 |
| 1.125 | 0.980785 | -0.382683 |
| 1.25 | 0.92388 | -0.707107 |
| 1.375 | 0.83147 | -0.92388 |
| 1.5 | 0.707107 | -1 |
| 1.625 | 0.55557 | -0.92388 |
| 1.75 | 0.382683 | -0.707107 |
| 1.875 | 0.19509 | -0.382683 |
| 2 | 0 | 0 |
| 2.125 | -0.19509 | 0.382683 |
| 2.25 | -0.382683 | 0.707107 |
| 2.375 | -0.55557 | 0.92388 |
| 2.5 | -0.707107 | 1 |
| 2.625 | -0.83147 | 0.92388 |
| 2.75 | -0.92388 | 0.707107 |
| 2.875 | -0.980785 | 0.382683 |
| 3 | -1 | 0 |
| 3.125 | -0.980785 | -0.382683 |
| 3.25 | -0.92388 | -0.707107 |
| 3.375 | -0.83147 | -0.92388 |
| 3.5 | -0.707107 | -1 |
| 3.625 | -0.55557 | -0.92388 |
| 3.75 | -0.382683 | -0.707107 |
| 3.875 | -0.19509 | -0.382683 |
| 4 | 0 | 0 |
| 4.125 | 0.19509 | 0.382683 |
| 4.25 | 0.382683 | 0.707107 |
| 4.375 | 0.55557 | 0.92388 |
| 4.5 | 0.707107 | 1 |
| 4.625 | 0.83147 | 0.92388 |
| 4.75 | 0.92388 | 0.707107 |
| 4.875 | 0.980785 | 0.382683 |
| 5 | 1 | 0 |
| 5.125 | 0.980785 | -0.382683 |
| 5.25 | 0.92388 | -0.707107 |
| 5.375 | 0.83147 | -0.92388 |
| 5.5 | 0.707107 | -1 |
| 5.625 | 0.55557 | -0.92388 |
| 5.75 | 0.382683 | -0.707107 |
| 5.875 | 0.19509 | -0.382683 |
| 6 | 0 | 0 |
| 6.125 | -0.19509 | 0.382683 |
| 6.25 | -0.382683 | 0.707107 |
| 6.375 | -0.55557 | 0.92388 |
| 6.5 | -0.707107 | 1 |
| 6.625 | -0.83147 | 0.92388 |
| 6.75 | -0.92388 | 0.707107 |
| 6.875 | -0.980785 | 0.382683 |
| 7 | -1 | 0 |
| 7.125 | -0.980785 | -0.382683 |
| 7.25 | -0.92388 | -0.707107 |
| 7.375 | -0.83147 | -0.92388 |
| 7.5 | -0.707107 | -1 |
| 7.625 | -0.55557 | -0.92388 |
| 7.75 | -0.382683 | -0.707107 |
| 7.875 | -0.19509 | -0.382683 |
| 8 | 0 | 0 |
Compare A with C before checking: which has the higher pitch, and does the
graph show a greater pressure amplitude?
C completes four cycles in 8 ms while A completes two. C therefore has a 2 ms period and frequency 500 Hz, higher than A’s 250 Hz, so C has higher pitch. Both pressure amplitudes are 1 Pa. The graph supports a frequency difference, not a greater amplitude for C. Real perceived loudness also depends on the listener and frequency; this comparison isolates the waveform quantities rather than claiming all equally sized signals sound equally loud to every listener.
Echoes and sound ranging
An echo is reflected sound. If the measured time covers the outward and return journey, the one-way distance is
d =v t/2
. With source and detector together, the pulse travels to the wall and then back along the same distance. At 340 m/s, a return time of 0.40 s gives a total path of 136 m. The wall is therefore 136 m / 2 = 68 m away. The factor two comes from the two equal journey legs, not from a rule to halve every sound measurement.
Try first: a detector across a field records a pulse 0.20 s after emission.
A learner calculates 340 × 0.20 / 2 = 34 m. Repair the first error.
This is a one-way arrival, not a returned echo. The measured path is the source-to-detector distance, so it is 340 × 0.20 = 68 m. Before choosing an equation, identify the emission, detection and any reflection, then count which journey legs the measured interval covers.
Repeating a timing over several pulses or claps increases the total timed interval and reduces the percentage effect of reaction time.
Practise
Practise: General properties of waves
A text-first wave and sound assessment with labelled controls and explicit directions, particle spacing, graph quantities, timings and units.
About 10 minutes
Practise
Questions are selected when you start. Use the feedback to decide what to practise next; this does not prove mastery.
Recent attempts
History is stored only in this browser.
No completed attempts are saved yet.
Beyond the syllabus: optional enrichment that does not count towards your progress.
Practise
Practise after feedback: General properties of waves
A text-first wave and sound assessment with labelled controls and explicit directions, particle spacing, graph quantities, timings and units.
About 10 minutes
Practise
Questions are selected when you start. Use the feedback to decide what to practise next; this does not prove mastery.
Recent attempts
History is stored only in this browser.
No completed attempts are saved yet.
Beyond the syllabus: optional enrichment that does not count towards your progress.
Check what I know
Check what I know: General properties of waves
A text-first wave and sound assessment with labelled controls and explicit directions, particle spacing, graph quantities, timings and units.
About 8 minutes
Check what I know
Answer 10 short questions. This starting check helps choose what to work on; it does not prove mastery.
Recent attempts
History is stored only in this browser.
No completed attempts are saved yet.
Beyond the syllabus: optional enrichment that does not count towards your progress.
Check my progress
Check my progress: General properties of waves
A text-first wave and sound assessment with labelled controls and explicit directions, particle spacing, graph quantities, timings and units.
About 10 minutes
Check my progress
Answer 11 questions. If accepted, this result can contribute to your course progress.
Recent attempts
History is stored only in this browser.
No completed attempts are saved yet.
Beyond the syllabus: optional enrichment that does not count towards your progress.
Check again
Check again: General properties of waves
A text-first wave and sound assessment with labelled controls and explicit directions, particle spacing, graph quantities, timings and units.
About 10 minutes
Check again
Answer 10 questions. If accepted, this result can contribute to your course progress.
Recent attempts
History is stored only in this browser.
No completed attempts are saved yet.
Beyond the syllabus: optional enrichment that does not count towards your progress.
Review
Review: General properties of waves
A text-first wave and sound assessment with labelled controls and explicit directions, particle spacing, graph quantities, timings and units.
About 10 minutes
Review
Answer 11 questions. A scheduled review can contribute to your course progress only when it is due and the result is accepted.
Recent attempts
History is stored only in this browser.
No completed attempts are saved yet.
Beyond the syllabus: optional enrichment that does not count towards your progress.
Course and syllabus information
- Course
- SEC G3 Combined Science Physics component
- Edition
- SEC G3 Combined Science Physics component 2027