Random Nature of Radioactive Decay (Count Rate & Background Radiation)
Key idea: Explain why radioactive decay is random, interpret fluctuating count-rate data, and correct measurements for background radiation (A Level Physics).
Continue where you stopped
The core idea
On this page
Learning objectives
- Analyse random radioactive decay, activity, decay constant and half-life.
1. Definitions (Must Know)
- Radioactive decay: a spontaneous nuclear process where an unstable nucleus emits radiation.
- Random: each nucleus has the same probability of decaying per unit time, but you cannot predict which nucleus will decay next.
- Count rate: number of detected counts per unit time (e.g. counts per second, s⁻¹).
- Background radiation: ionising radiation detected even when no source is present.
- Corrected count rate is the measured rate minus the background rate.
Rₙₑₜ = R_measured-R_background
2. Key Ideas (What Earns Marks)
- The count rate fluctuates even if the source and geometry are unchanged, because decay is random.
- Over longer times / more counts, the fractional fluctuation becomes smaller, so averaging improves reliability.
- Background radiation creates a baseline that must be subtracted to avoid systematic error.
- When finding half-life or decay constant from data:
- subtract background first
- then analyse the exponential trend
3. Detailed Explanations
A. What “random” means in decay
Radioactive decay is:
- spontaneous: no external trigger is needed
- random: you cannot predict which nucleus will decay next
But it is also statistically predictable for large numbers of nuclei: the average activity decreases exponentially with time.
B. Why count rate fluctuates
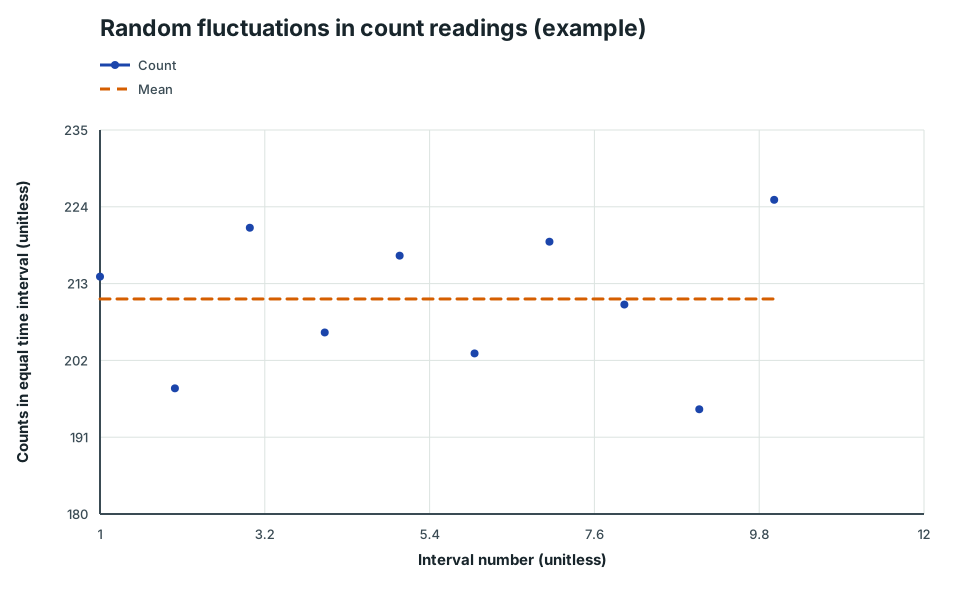
A Geiger–Müller tube detects individual decay events. Even with a steady source, the number of decays in equal time intervals varies from interval to interval:
- interval 1: 214 counts
- interval 2: 198 counts
- interval 3: 221 counts
This scatter is evidence that decay is random (the syllabus expects you to infer this from fluctuations).
Random fluctuations in count readings (example)
Scatter plot of counts recorded in equal time intervals, showing random fluctuations about a steady mean.
Scroll across the graph to read all labels.
View figure data
| Series | Interval number (unitless) | Interval number uncertainty | Counts in equal time interval (unitless) | Counts in equal time interval uncertainty |
|---|---|---|---|---|
| Count | 1 | 214 | ||
| Count | 2 | 198 | ||
| Count | 3 | 221 | ||
| Count | 4 | 206 | ||
| Count | 5 | 217 | ||
| Count | 6 | 203 | ||
| Count | 7 | 219 | ||
| Count | 8 | 210 | ||
| Count | 9 | 195 | ||
| Count | 10 | 225 | ||
| Mean | 1 | 210.8 | ||
| Mean | 10 | 210.8 |
C. Background radiation and why we correct for it
Background radiation comes from:
- cosmic rays
- rocks/soil (e.g. radon and its decay products)
- building materials
- living organisms / food
If you do not subtract background, you overestimate the source’s activity and distort half-life calculations, especially when the source is weak.
4. Common Mistakes
- Forgetting to subtract background before plotting / calculating half-life.
- Subtracting background counts when the time interval is different (mixing counts with count rate).
- Treating a single “odd” data point as proof something is wrong (random fluctuations are expected).
5. Exam Tips
- Always state units (counts s⁻¹, Bq).
- Use “count rate fluctuates due to the random nature of radioactive decay” as the mark-scheme phrase.
- If asked how to reduce random uncertainty: measure for longer time, repeat and average, keep geometry fixed.
6. Worked Examples
Modelled example 1
Background correction
Problem
Study the worked solution
Separate source and background
Method
The measured rate contains both contributions.Reason
Background events are detected even when the source is absent.Working
R_measured = R_source + R_backgroundSubtract matching rates
Method
Rₙₑₜ = 2.00 s⁻¹.Reason
Both quantities are count rates measured in the same unit.Working
Rₙₑₜ = 2.40-0.40 = 2.00 s⁻¹
Guided practice 2
Counts vs count rate
Problem
Try this before viewing the solution
Hints
Hint 1: normalise the time bases
View solution step by step
Find background rate
Method
R_b = 0.60 s⁻¹.Reason
Count rate is counts divided by observation time.Working
R_b = 36/60 = 0.60 s⁻¹Find measured rate
Method
Rₘ = 3.00 s⁻¹.Reason
The source-present total was measured over a different duration.Working
Rₘ = 210/70 = 3.00 s⁻¹Correct for background
Method
Rₙₑₜ = 2.40 s⁻¹.Reason
Rates on a common per-second basis can now be subtracted.Working
Rₙₑₜ = 3.00-0.60 = 2.40 s⁻¹
Common misconception 3
Background correction with different counting times
Learner claim
Try this before viewing the solution
View solution step by step
Diagnose the subtraction
Method
The raw totals cannot be subtracted directly.Reason
They represent different counting times and therefore different time bases.Working
620 counts in 100 s ≠ 620 counts in 200 sConvert both rates
Method
R_b = 0.60 s⁻¹ and Rₘ = 6.20 s⁻¹.Reason
Each total must be divided by its own measurement time.Working
R_b = 120/200 = 0.60 s⁻¹, Rₘ = 620/100 = 6.20 s⁻¹Subtract the rates
Method
Rₙₑₜ = 5.60 s⁻¹.Reason
Both values now describe counts per second.Working
Rₙₑₜ = 6.20-0.60 = 5.60 s⁻¹
Examiner practice 4
Mean count rate from repeated readings
Examination question
Try this before viewing the solution
View solution step by step
Sum the counts
1 markMethod
Nₜₒₜₐₗ = 250 counts.Reason
Pooling equal-duration repeats is equivalent to averaging their count rates.Working
52 + 47 + 55 + 46 + 50 = 250Sum the observation time
1 markMethod
tₜₒₜₐₗ = 100 s.Reason
Five intervals each lasted 20 s.Working
tₜₒₜₐₗ = 5(20) = 100 sCalculate mean rate
1 markMethod
R = 2.50 s⁻¹.Reason
Mean rate is total detected events divided by total observation time.Working
R = 250/100 = 2.50 s⁻¹
Self-mark with the mark scheme
Compare your response with each mark point. Select a point only when your response contains that evidence.
Self-mark total counts, total time and mean rate.
Challenge 5
Source count rate when background is a fraction
Independent transfer
Try this before viewing the solution
Hints
Hint 1: translate the percentage
View solution step by step
Find background rate
Method
R_b = 0.90 s⁻¹.Reason
The background is defined as 20% of the measured source-present rate.Working
R_b = 0.20(4.5) = 0.90 s⁻¹Find net source rate
Method
Rₙₑₜ = 3.6 s⁻¹.Reason
Remove the background contribution from the measured total.Working
Rₙₑₜ = 4.5-0.90 = 3.6 s⁻¹
7. Mind Stretchers
Mind stretcher 1: Explaining a “noisy” graphExtension
A student records count rate every 10 s and plots it against time. The points jump up and down around a smooth decreasing curve. Explain why this happens and state one way to improve the graph.
Show Answer
The jumping up and down is due to random fluctuations in the number of decays detected in each 10 s interval, because radioactive decay is random.
To improve: measure for longer per reading (e.g. 30 s or 60 s), repeat readings and average, and subtract background before plotting.
Mind stretcher 2: When does background subtraction matter most?Extension
You are measuring a weak source far from the detector. Explain why background subtraction becomes more important, and what happens if you ignore it.
Show Answer
For a weak source, the measured count rate is closer to the background level, so background can be a large fraction of the measurement.
If you ignore background, you overestimate the source’s count rate and can get incorrect decay/half-life values (especially at late times when the source is weak).
Continue with the next resource in this course.
Course and syllabus information
- Course
- GCE A-Level H2 Physics
- Edition
- GCE A-Level H2 Physics 2027