Progressive waves, wave graphs and phase difference
Key idea: Waves transfer energy without net matter transfer, and v = fλ. A time graph gives period; a distance graph gives wavelength, so phase differences must use the matching interval.
Loading guide controls…
Guided lessons · coming soon
More
Offline pages
Saved on this device only. Connect at least once every 30 days to confirm Premium. Sign-out or a change of account removes saved copies.
Guided steps
- Follow one material point, rather than a crest. In the ideal mechanical wave, that point oscillates about its equilibrium position and returns after one cycle. Neighbouring particles pass energy along by pushing or pulling each other. An electromagnetic wave instead involves oscillating electric and magnetic fields and needs no material medium. Transverse and longitudinal describe the oscillation direction relative to the direction the pattern travels.
- Before playing, predict the marked particle and crest positions after one period. Play one cycle, then compare the particle position, its displacement and the tracked crest position. Keep those three observations separate.
- A period is one complete oscillation in time. A wavelength is one complete repetition along space. During one period the pattern advances by one wavelength, so pattern speed is wavelength divided by period. Frequency is one divided by period, which gives speed equals frequency times wavelength. A particle has a changing velocity as it oscillates; this is a different quantity from pattern speed.
- Read the horizontal axis before interpreting the sinusoid. A distance graph compares different particles at one instant, so one full horizontal cycle is a wavelength. A time graph follows one fixed particle, so one cycle is a period. To infer initial particle motion from a snapshot, imagine the profile shifting in its stated travel direction. The displacement approaching the point tells you which way that particle starts to move.
- Find the profile shift and the particle’s initial motion.
- Explain what crest spacing means on each graph.
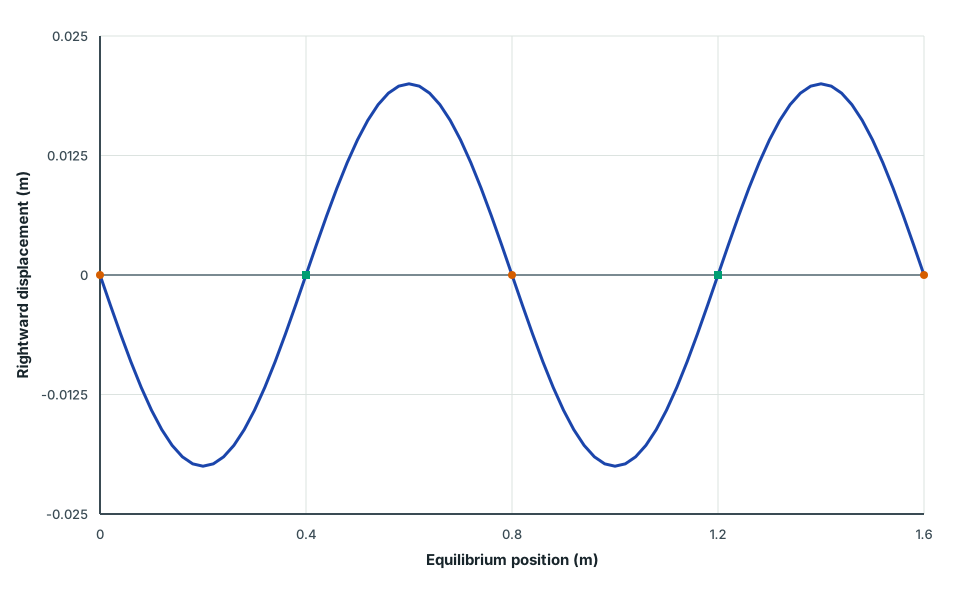
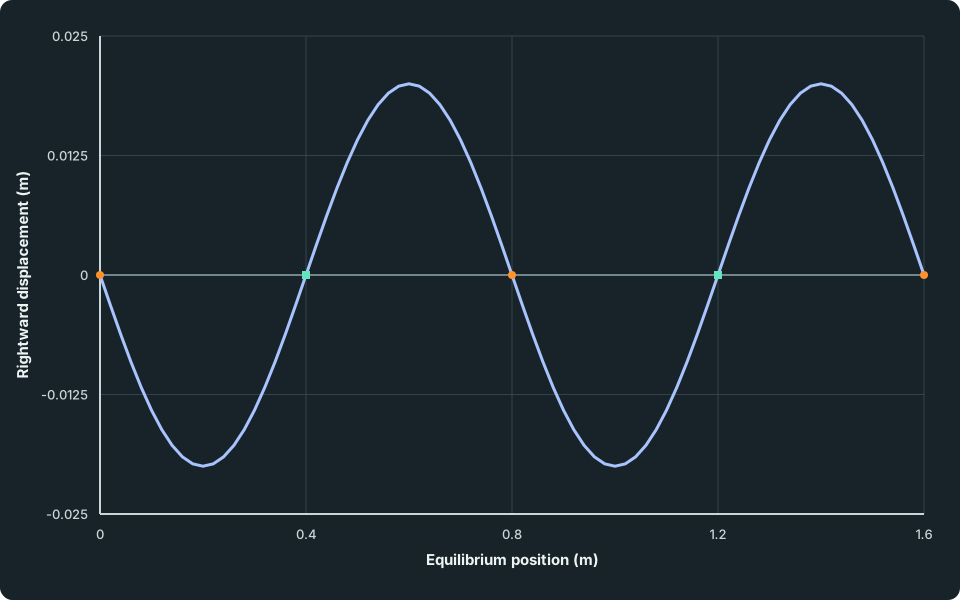
- This graph plots longitudinal displacement vertically for reading, although the real particles move horizontally. Take rightwards displacement as positive. Across a downward zero crossing, the left neighbour is displaced right and the right neighbour is displaced left, crowding the particles into a compression. Across an upward crossing they are displaced apart. This compares displacements from equilibrium, not instantaneous velocities. The peaks and troughs show greatest displacement, not greatest compression.
- Phase locates a stage in a cycle. Divide a separation by the corresponding full cycle, then multiply by two pi to express it in radians. Use distance over wavelength for a snapshot and time delay over period for time traces. Remove whole cycles if necessary. When replacing an angle greater than pi by its smaller complement, reverse the lead or lag description. A constant phase difference requires equal frequencies.
- Use each graph for the information it actually contains. The snapshot gives wavelength; the fixed-point trace gives period. Dividing wavelength by period gives speed. For phase, divide the particle separation by wavelength to find the cycle fraction, then convert that fraction to radians. Check whether the separation is less than half a wavelength before choosing the smaller angle.
- Find the phase difference and identify which oscillation leads.
- Find compression spacing, wave speed and phase difference.
- Find the smallest phase difference and identify the lead.
- Explain how wave graphs give speed and phase difference.
- Use the crest travel to find pattern speed and the marker oscillation to find period. Work out wavelength and phase, then explain whether the pattern speed describes the marker net motion. Compare your working with the public answer; this is self-review.
On this page
You stopped at:
ContinueRevision Mode is on. Questions and activities are hidden.
The linked question or activity is hidden by Revision Mode.
A wave carries energy from one place to another without carrying the material along with it. This lesson defines the quantities that describe a wave, from amplitude to speed, and derives v = fλ. It then shows how to read the two kinds of wave graph, and how to find the phase difference between two oscillations, which you will need for every later idea in this topic: superposition, interference and standing waves.
Waves transfer energy, not matter
In a mechanical wave, such as a wave on a string, sound in air or a ripple on water, the particles of a material medium oscillate about their equilibrium positions. Each particle pulls or pushes on its neighbours as it moves, doing work on them, so energy passes along the medium. In the ideal small-amplitude model, each particle returns after a full cycle: the disturbance and its energy travel, the matter does not.
In an electromagnetic wave, such as light or microwaves, electric and magnetic fields oscillate in space and time. No material medium is required: the wave can travel through a vacuum.
A wave that carries energy away from its source like this is a progressive wave. Waves come in two types:
- in a transverse wave, the oscillations are perpendicular to the direction the wave travels: waves on a string, and all electromagnetic waves;
- in a longitudinal wave, the oscillations are parallel to the direction of travel: sound in air. The particles crowd together in compressions and spread apart in rarefactions.
Follow one particle and one crest
A transverse wave: the marked particle stays at x = 1.2 metres and its displacement is 0.088 metres. The tracked crest is at x = 1.50 metres. Play runs one period; the window scales with wavelength to keep the tracked crest visible.
- Particle equilibrium x
- 1.20 m
- Particle displacement y
- 0.088 m
- Tracked crest x
- 1.50 m
- Frequency, f
- 1.00 Hz
- Period, T
- 1.00 s
- Wave speed, v
- 2.00 m/s
- Ruler reading
- 1.00 m
- Distance, d
- 170.0 m
- Echo time, t
- — s
Try this
0 of 1 donePredict where the particle and crest will be after one period, then play one cycle. (not done yet)
The particle returns to its starting displacement at the same x. The tracked crest advances by vT = λ.
You’ve tried every task.
Your readings
| # | d / m | t / s | 2d / m | Remove |
|---|---|---|---|---|
| No readings yet. Set up a measurement, then record it. | ||||
This transverse-string model uses y(x,t) = A sin[2πf(t − x/v)]. The marked material point keeps its x coordinate while the tracked crest travels; vertical scale is exaggerated. The focused view retunes the whole wave and restarts its cycle when you change a setting. Its window adjusts to keep the tracked crest visible for one period. The ordinary Rope mode instead lets a source change spread along the medium.
The quantities that describe a wave
| Quantity | Symbol and unit | Meaning |
|---|---|---|
| displacement | y, m | distance of a particle from its equilibrium position, in a stated direction (so it can be negative) |
| amplitude | A, m | the maximum magnitude of displacement |
| period | T, s | the time for one complete oscillation of a particle |
| frequency | f, Hz | the number of oscillations per unit time; f = 1/T |
| wavelength | λ, m | the distance between two neighbouring points that are in phase, such as two crests |
| wave speed | v, m s⁻¹ | the distance the wave pattern travels per unit time |
The wave equation follows from these definitions. In one period, each particle completes one oscillation, and in that time the pattern moves forward by exactly one wavelength. So the speed of the pattern is
This is the speed of the wave, not of any particle. The particles move back and forth, with speeds that change continually through each cycle.
Two kinds of wave graph
A wave changes with both position and time, so a graph has to hold one of them fixed.
- A displacement–distance graph is a snapshot: the displacement of every particle at one instant. One cycle along the horizontal axis is the wavelength λ.
- A displacement–time graph follows one particle: its displacement as time passes. One cycle along the horizontal axis is the period T.
The two graphs can look identical. Always read the horizontal axis before naming a spacing.
Read the horizontal axis first
- Displacement against position
- Record a snapshot at one instant. One complete cycle along the position axis spans wavelength λ, measured in metres.
- Displacement against time
- Follow one fixed position. One complete cycle along the time axis takes period T, measured in seconds.
Both graphs show signed displacement vertically. For a longitudinal wave, a positive plotted value represents displacement along the chosen positive direction, not upward motion.
The graphs below show a wave with amplitude 0.020 m, wavelength 0.80 m and period 0.25 s, travelling to the right. The first shows the profile at t = 0 and a quarter of a period later; the second follows the particle at x = 0.
A wave profile advances through space
Two sinusoidal displacement profiles with amplitude 0.020 m and wavelength 0.80 m. At x = 0 displacement changes from zero to −0.020 m.
If the figure is wider than its frame, scroll across to read all labels.
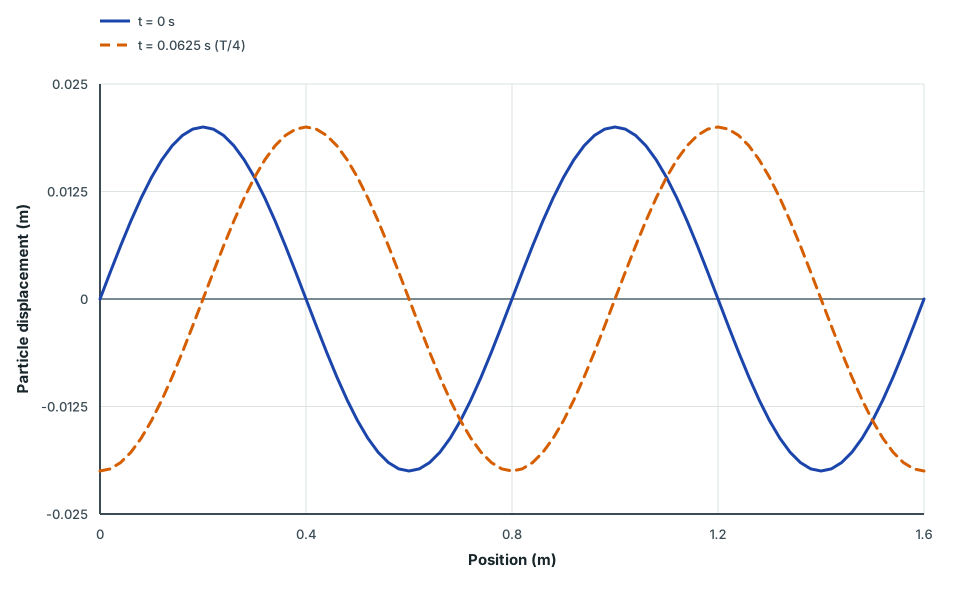
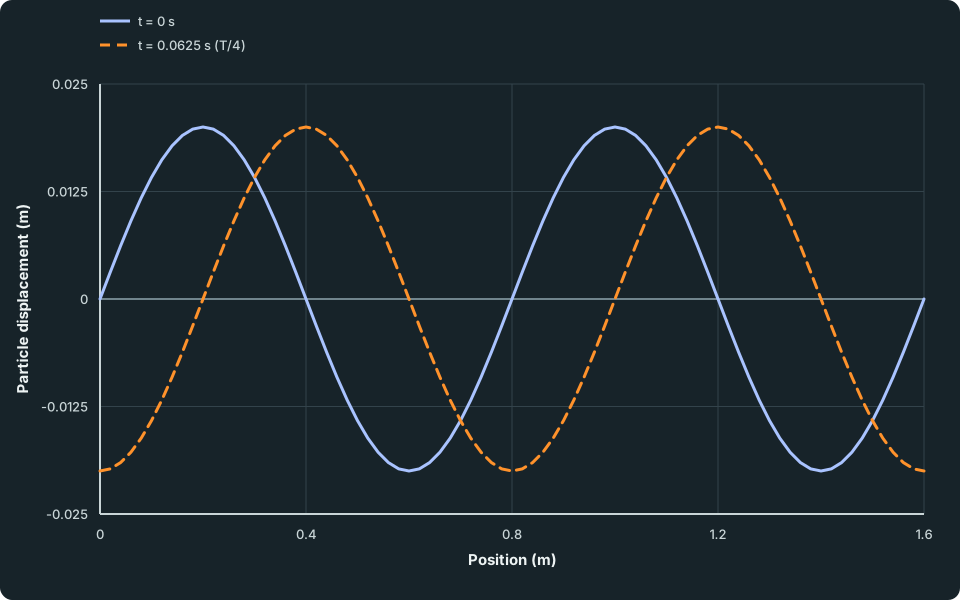
View figure data
This table is included in print while it is open.
| Position (m) | t = 0 s | t = 0.0625 s (T/4) |
|---|---|---|
| 0.00 | 0.000000 | -0.020000 |
| 0.02 | 0.003129 | -0.019754 |
| 0.04 | 0.006180 | -0.019021 |
| 0.06 | 0.009080 | -0.017820 |
| 0.08 | 0.011756 | -0.016180 |
| 0.10 | 0.014142 | -0.014142 |
| 0.12 | 0.016180 | -0.011756 |
| 0.14 | 0.017820 | -0.009080 |
| 0.16 | 0.019021 | -0.006180 |
| 0.18 | 0.019754 | -0.003129 |
| 0.20 | 0.020000 | 0.000000 |
| 0.22 | 0.019754 | 0.003129 |
| 0.24 | 0.019021 | 0.006180 |
| 0.26 | 0.017820 | 0.009080 |
| 0.28 | 0.016180 | 0.011756 |
| 0.30 | 0.014142 | 0.014142 |
| 0.32 | 0.011756 | 0.016180 |
| 0.34 | 0.009080 | 0.017820 |
| 0.36 | 0.006180 | 0.019021 |
| 0.38 | 0.003129 | 0.019754 |
| 0.40 | 0.000000 | 0.020000 |
| 0.42 | -0.003129 | 0.019754 |
| 0.44 | -0.006180 | 0.019021 |
| 0.46 | -0.009080 | 0.017820 |
| 0.48 | -0.011756 | 0.016180 |
| 0.50 | -0.014142 | 0.014142 |
| 0.52 | -0.016180 | 0.011756 |
| 0.54 | -0.017820 | 0.009080 |
| 0.56 | -0.019021 | 0.006180 |
| 0.58 | -0.019754 | 0.003129 |
| 0.60 | -0.020000 | 0.000000 |
| 0.62 | -0.019754 | -0.003129 |
| 0.64 | -0.019021 | -0.006180 |
| 0.66 | -0.017820 | -0.009080 |
| 0.68 | -0.016180 | -0.011756 |
| 0.70 | -0.014142 | -0.014142 |
| 0.72 | -0.011756 | -0.016180 |
| 0.74 | -0.009080 | -0.017820 |
| 0.76 | -0.006180 | -0.019021 |
| 0.78 | -0.003129 | -0.019754 |
| 0.80 | 0.000000 | -0.020000 |
| 0.82 | 0.003129 | -0.019754 |
| 0.84 | 0.006180 | -0.019021 |
| 0.86 | 0.009080 | -0.017820 |
| 0.88 | 0.011756 | -0.016180 |
| 0.90 | 0.014142 | -0.014142 |
| 0.92 | 0.016180 | -0.011756 |
| 0.94 | 0.017820 | -0.009080 |
| 0.96 | 0.019021 | -0.006180 |
| 0.98 | 0.019754 | -0.003129 |
| 1.00 | 0.020000 | 0.000000 |
| 1.02 | 0.019754 | 0.003129 |
| 1.04 | 0.019021 | 0.006180 |
| 1.06 | 0.017820 | 0.009080 |
| 1.08 | 0.016180 | 0.011756 |
| 1.10 | 0.014142 | 0.014142 |
| 1.12 | 0.011756 | 0.016180 |
| 1.14 | 0.009080 | 0.017820 |
| 1.16 | 0.006180 | 0.019021 |
| 1.18 | 0.003129 | 0.019754 |
| 1.20 | 0.000000 | 0.020000 |
| 1.22 | -0.003129 | 0.019754 |
| 1.24 | -0.006180 | 0.019021 |
| 1.26 | -0.009080 | 0.017820 |
| 1.28 | -0.011756 | 0.016180 |
| 1.30 | -0.014142 | 0.014142 |
| 1.32 | -0.016180 | 0.011756 |
| 1.34 | -0.017820 | 0.009080 |
| 1.36 | -0.019021 | 0.006180 |
| 1.38 | -0.019754 | 0.003129 |
| 1.40 | -0.020000 | 0.000000 |
| 1.42 | -0.019754 | -0.003129 |
| 1.44 | -0.019021 | -0.006180 |
| 1.46 | -0.017820 | -0.009080 |
| 1.48 | -0.016180 | -0.011756 |
| 1.50 | -0.014142 | -0.014142 |
| 1.52 | -0.011756 | -0.016180 |
| 1.54 | -0.009080 | -0.017820 |
| 1.56 | -0.006180 | -0.019021 |
| 1.58 | -0.003129 | -0.019754 |
| 1.60 | 0.000000 | -0.020000 |
Follow one position as the wave passes
A displacement–time trace at x = 0 starts at zero, falls to −0.020 m after a quarter period, and returns to the same phase after 0.25 s.
If the figure is wider than its frame, scroll across to read all labels.
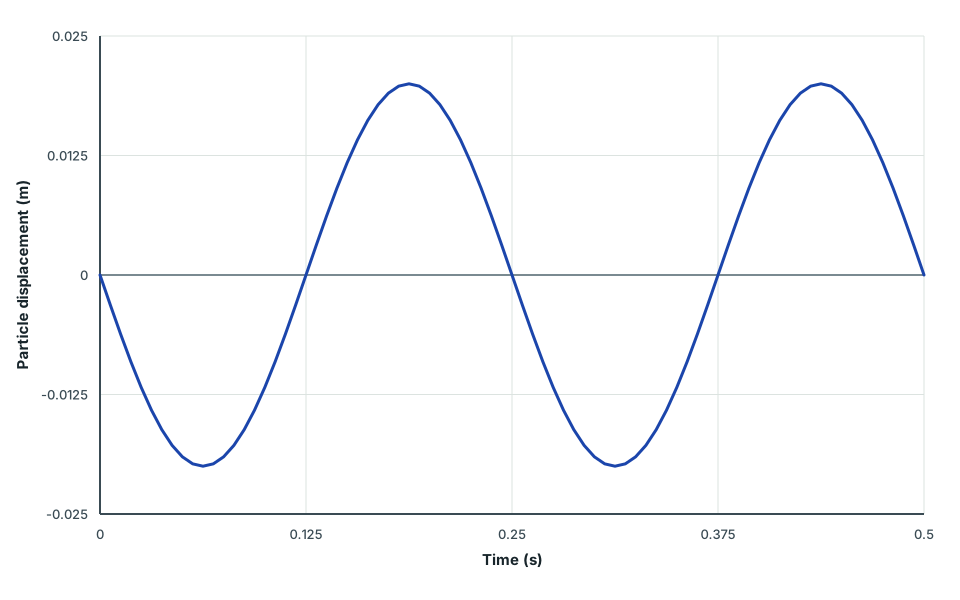
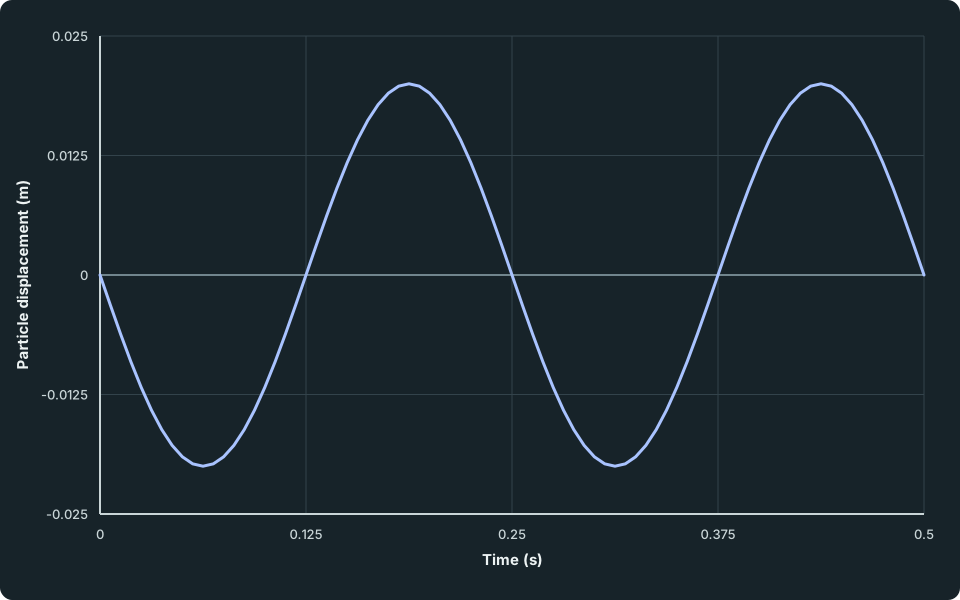
View figure data
This table is included in print while it is open.
| Time (s) | x = 0 m |
|---|---|
| 0.00000 | 0.000000 |
| 0.00625 | -0.003129 |
| 0.01250 | -0.006180 |
| 0.01875 | -0.009080 |
| 0.02500 | -0.011756 |
| 0.03125 | -0.014142 |
| 0.03750 | -0.016180 |
| 0.04375 | -0.017820 |
| 0.05000 | -0.019021 |
| 0.05625 | -0.019754 |
| 0.06250 | -0.020000 |
| 0.06875 | -0.019754 |
| 0.07500 | -0.019021 |
| 0.08125 | -0.017820 |
| 0.08750 | -0.016180 |
| 0.09375 | -0.014142 |
| 0.10000 | -0.011756 |
| 0.10625 | -0.009080 |
| 0.11250 | -0.006180 |
| 0.11875 | -0.003129 |
| 0.12500 | 0.000000 |
| 0.13125 | 0.003129 |
| 0.13750 | 0.006180 |
| 0.14375 | 0.009080 |
| 0.15000 | 0.011756 |
| 0.15625 | 0.014142 |
| 0.16250 | 0.016180 |
| 0.16875 | 0.017820 |
| 0.17500 | 0.019021 |
| 0.18125 | 0.019754 |
| 0.18750 | 0.020000 |
| 0.19375 | 0.019754 |
| 0.20000 | 0.019021 |
| 0.20625 | 0.017820 |
| 0.21250 | 0.016180 |
| 0.21875 | 0.014142 |
| 0.22500 | 0.011756 |
| 0.23125 | 0.009080 |
| 0.23750 | 0.006180 |
| 0.24375 | 0.003129 |
| 0.25000 | 0.000000 |
| 0.25625 | -0.003129 |
| 0.26250 | -0.006180 |
| 0.26875 | -0.009080 |
| 0.27500 | -0.011756 |
| 0.28125 | -0.014142 |
| 0.28750 | -0.016180 |
| 0.29375 | -0.017820 |
| 0.30000 | -0.019021 |
| 0.30625 | -0.019754 |
| 0.31250 | -0.020000 |
| 0.31875 | -0.019754 |
| 0.32500 | -0.019021 |
| 0.33125 | -0.017820 |
| 0.33750 | -0.016180 |
| 0.34375 | -0.014142 |
| 0.35000 | -0.011756 |
| 0.35625 | -0.009080 |
| 0.36250 | -0.006180 |
| 0.36875 | -0.003129 |
| 0.37500 | 0.000000 |
| 0.38125 | 0.003129 |
| 0.38750 | 0.006180 |
| 0.39375 | 0.009080 |
| 0.40000 | 0.011756 |
| 0.40625 | 0.014142 |
| 0.41250 | 0.016180 |
| 0.41875 | 0.017820 |
| 0.42500 | 0.019021 |
| 0.43125 | 0.019754 |
| 0.43750 | 0.020000 |
| 0.44375 | 0.019754 |
| 0.45000 | 0.019021 |
| 0.45625 | 0.017820 |
| 0.46250 | 0.016180 |
| 0.46875 | 0.014142 |
| 0.47500 | 0.011756 |
| 0.48125 | 0.009080 |
| 0.48750 | 0.006180 |
| 0.49375 | 0.003129 |
| 0.50000 | 0.000000 |
In a quarter of a period, the whole profile shifts a quarter of a wavelength to the right. That gives a quick way to find which way any particle is moving: for a wave travelling right, each particle is about to take the displacement that the particle just to its left has now.
Check your understanding 1
Translate between wave snapshots and time graphs
Check your understanding 1
Translate between wave snapshots and time graphs
Another wave travels to the left with wavelength 1.20 m and period 0.40 s. In a snapshot, the displacement at P is zero and the particles immediately to its right have positive displacement. How far does the profile move in 0.10 s? Which way does P move initially, and what sign should its time-graph gradient have?
Show the steps Optional working
Show answer
The wave speed is 1.20/0.40 = 3.0 m s⁻¹, so the profile moves 3.0(0.10) = 0.30 m to the left. P takes the displacement currently just to its right, so its displacement initially becomes positive. Its time graph must therefore initially have a positive gradient. The 0.30 m describes the travelling profile, rather than a particle’s travel.
Spot the mistake 1
“Crest spacing is always the wavelength”
Spot the mistake 1
“Crest spacing is always the wavelength”
Learner claim
A learner says: “The horizontal distance between neighbouring crests on a wave graph is always the wavelength.” When is this true, and what does the spacing mean otherwise?
Diagnose the claim
Show solution step by step
Read the axis
Method
Check whether the horizontal axis is position or time.Reason
A cycle along space is a wavelength; a cycle along time is a period.Working
Answer
On a displacement–distance graph at one instant, the crest spacing is λ.
Name the other case
Working
Answer
On a displacement–time graph at one position, the crest spacing is the period T, measured in seconds.
Common mistake
The two graphs can look identical, which is why the claim is tempting. Write the horizontal-axis quantity beside a sketch before naming any spacing.
Graphs of longitudinal waves
A displacement–distance graph of a longitudinal wave still plots displacement upwards, even though the particles move along the direction of travel. Take displacement to the right as positive. Where the graph slopes most steeply downwards, the particle on the left is displaced right and the particle on the right is displaced left: they have moved towards each other, so that is the centre of a compression. Where the graph slopes most steeply upwards, neighbouring particles have moved apart: the centre of a rarefaction. The peaks and troughs of the graph are neither.
Compression occurs at a downward zero crossing
An ideal longitudinal displacement snapshot of wavelength 0.80 m. Compression centres are at x = 0, 0.80 and 1.60 m; rarefaction centres are at x = 0.40 and 1.20 m. The displacement extrema are between these centres.
If the figure is wider than its frame, scroll across to read all labels.
View figure data
This table is included in print while it is open.
| Series | Equilibrium position (m) | Rightward displacement (m) |
|---|---|---|
| Longitudinal displacement | 0.00 | 0.000000 |
| Longitudinal displacement | 0.02 | -0.003129 |
| Longitudinal displacement | 0.04 | -0.006180 |
| Longitudinal displacement | 0.06 | -0.009080 |
| Longitudinal displacement | 0.08 | -0.011756 |
| Longitudinal displacement | 0.10 | -0.014142 |
| Longitudinal displacement | 0.12 | -0.016180 |
| Longitudinal displacement | 0.14 | -0.017820 |
| Longitudinal displacement | 0.16 | -0.019021 |
| Longitudinal displacement | 0.18 | -0.019754 |
| Longitudinal displacement | 0.20 | -0.020000 |
| Longitudinal displacement | 0.22 | -0.019754 |
| Longitudinal displacement | 0.24 | -0.019021 |
| Longitudinal displacement | 0.26 | -0.017820 |
| Longitudinal displacement | 0.28 | -0.016180 |
| Longitudinal displacement | 0.30 | -0.014142 |
| Longitudinal displacement | 0.32 | -0.011756 |
| Longitudinal displacement | 0.34 | -0.009080 |
| Longitudinal displacement | 0.36 | -0.006180 |
| Longitudinal displacement | 0.38 | -0.003129 |
| Longitudinal displacement | 0.40 | 0.000000 |
| Longitudinal displacement | 0.42 | 0.003129 |
| Longitudinal displacement | 0.44 | 0.006180 |
| Longitudinal displacement | 0.46 | 0.009080 |
| Longitudinal displacement | 0.48 | 0.011756 |
| Longitudinal displacement | 0.50 | 0.014142 |
| Longitudinal displacement | 0.52 | 0.016180 |
| Longitudinal displacement | 0.54 | 0.017820 |
| Longitudinal displacement | 0.56 | 0.019021 |
| Longitudinal displacement | 0.58 | 0.019754 |
| Longitudinal displacement | 0.60 | 0.020000 |
| Longitudinal displacement | 0.62 | 0.019754 |
| Longitudinal displacement | 0.64 | 0.019021 |
| Longitudinal displacement | 0.66 | 0.017820 |
| Longitudinal displacement | 0.68 | 0.016180 |
| Longitudinal displacement | 0.70 | 0.014142 |
| Longitudinal displacement | 0.72 | 0.011756 |
| Longitudinal displacement | 0.74 | 0.009080 |
| Longitudinal displacement | 0.76 | 0.006180 |
| Longitudinal displacement | 0.78 | 0.003129 |
| Longitudinal displacement | 0.80 | 0.000000 |
| Longitudinal displacement | 0.82 | -0.003129 |
| Longitudinal displacement | 0.84 | -0.006180 |
| Longitudinal displacement | 0.86 | -0.009080 |
| Longitudinal displacement | 0.88 | -0.011756 |
| Longitudinal displacement | 0.90 | -0.014142 |
| Longitudinal displacement | 0.92 | -0.016180 |
| Longitudinal displacement | 0.94 | -0.017820 |
| Longitudinal displacement | 0.96 | -0.019021 |
| Longitudinal displacement | 0.98 | -0.019754 |
| Longitudinal displacement | 1.00 | -0.020000 |
| Longitudinal displacement | 1.02 | -0.019754 |
| Longitudinal displacement | 1.04 | -0.019021 |
| Longitudinal displacement | 1.06 | -0.017820 |
| Longitudinal displacement | 1.08 | -0.016180 |
| Longitudinal displacement | 1.10 | -0.014142 |
| Longitudinal displacement | 1.12 | -0.011756 |
| Longitudinal displacement | 1.14 | -0.009080 |
| Longitudinal displacement | 1.16 | -0.006180 |
| Longitudinal displacement | 1.18 | -0.003129 |
| Longitudinal displacement | 1.20 | 0.000000 |
| Longitudinal displacement | 1.22 | 0.003129 |
| Longitudinal displacement | 1.24 | 0.006180 |
| Longitudinal displacement | 1.26 | 0.009080 |
| Longitudinal displacement | 1.28 | 0.011756 |
| Longitudinal displacement | 1.30 | 0.014142 |
| Longitudinal displacement | 1.32 | 0.016180 |
| Longitudinal displacement | 1.34 | 0.017820 |
| Longitudinal displacement | 1.36 | 0.019021 |
| Longitudinal displacement | 1.38 | 0.019754 |
| Longitudinal displacement | 1.40 | 0.020000 |
| Longitudinal displacement | 1.42 | 0.019754 |
| Longitudinal displacement | 1.44 | 0.019021 |
| Longitudinal displacement | 1.46 | 0.017820 |
| Longitudinal displacement | 1.48 | 0.016180 |
| Longitudinal displacement | 1.50 | 0.014142 |
| Longitudinal displacement | 1.52 | 0.011756 |
| Longitudinal displacement | 1.54 | 0.009080 |
| Longitudinal displacement | 1.56 | 0.006180 |
| Longitudinal displacement | 1.58 | 0.003129 |
| Longitudinal displacement | 1.60 | 0.000000 |
| Compression centres | 0.00 | 0.000000 |
| Compression centres | 0.80 | 0.000000 |
| Compression centres | 1.60 | 0.000000 |
| Rarefaction centres | 0.40 | 0.000000 |
| Rarefaction centres | 1.20 | 0.000000 |
At x = 0.80 m, neighbours are displaced towards this compression centre; at x = 0.40 m they are displaced away from the rarefaction centre. These displacements from equilibrium do not state the particles’ instantaneous velocities. The vertical axis represents horizontal particle displacement, not a transverse motion or the pressure. Compare the circle and square markers at the two kinds of zero crossing.
Phase and phase difference
The phase of an oscillating particle says how far through its cycle it is. One complete cycle is 2π radians, or 360°, so a particle a quarter of the way through its cycle has moved on by π/2.
The phase difference between two oscillations of the same frequency is how far one is ahead of the other, as a fraction of a cycle expressed as an angle:
- two oscillations in phase (phase difference 0, 2π, …) reach their maxima at the same time;
- two oscillations in antiphase (phase difference π) have opposite displacements: one is at a maximum when the other is at a minimum. When moving, they move in opposite directions.
A constant phase difference requires equal frequencies. If they differ, the oscillations drift in and out of step and the phase difference keeps changing.
Two waves with a phase difference of π/2
Example of two sine waves with the same frequency but a constant phase difference.
If the figure is wider than its frame, scroll across to read all labels.
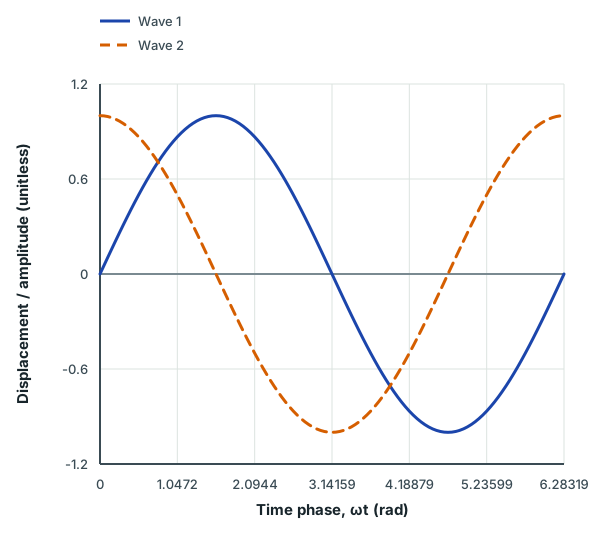
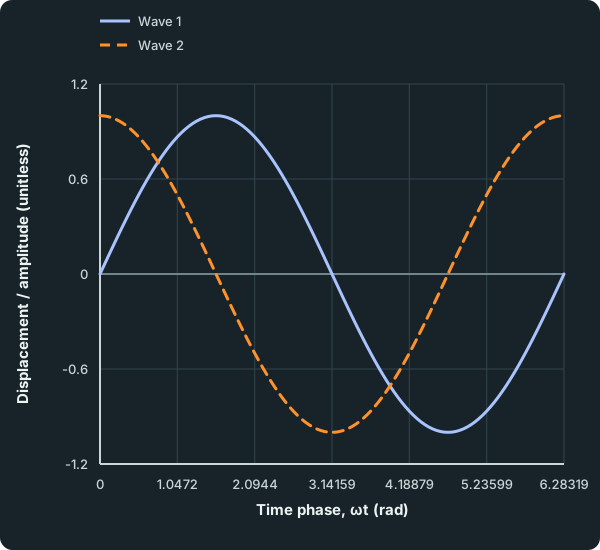
Show the waves separately and together. Compare the positions of corresponding crests with their common wavelength.
Optional interaction loads only after you choose Explore graph.
View figure data
This table is included in print while it is open.
| Time phase, ωt (rad) | Wave 1 | Wave 2 |
|---|---|---|
| 0.00000 | 0.000e+00 | 1.000e+00 |
| 0.05236 | 5.234e-02 | 9.986e-01 |
| 0.10472 | 1.045e-01 | 9.945e-01 |
| 0.15708 | 1.564e-01 | 9.877e-01 |
| 0.20944 | 2.079e-01 | 9.781e-01 |
| 0.26180 | 2.588e-01 | 9.659e-01 |
| 0.31416 | 3.090e-01 | 9.511e-01 |
| 0.36652 | 3.584e-01 | 9.336e-01 |
| 0.41888 | 4.067e-01 | 9.135e-01 |
| 0.47124 | 4.540e-01 | 8.910e-01 |
| 0.52360 | 5.000e-01 | 8.660e-01 |
| 0.57596 | 5.446e-01 | 8.387e-01 |
| 0.62832 | 5.878e-01 | 8.090e-01 |
| 0.68068 | 6.293e-01 | 7.771e-01 |
| 0.73304 | 6.691e-01 | 7.431e-01 |
| 0.78540 | 7.071e-01 | 7.071e-01 |
| 0.83776 | 7.431e-01 | 6.691e-01 |
| 0.89012 | 7.771e-01 | 6.293e-01 |
| 0.94248 | 8.090e-01 | 5.878e-01 |
| 0.99484 | 8.387e-01 | 5.446e-01 |
| 1.04720 | 8.660e-01 | 5.000e-01 |
| 1.09956 | 8.910e-01 | 4.540e-01 |
| 1.15192 | 9.135e-01 | 4.067e-01 |
| 1.20428 | 9.336e-01 | 3.584e-01 |
| 1.25664 | 9.511e-01 | 3.090e-01 |
| 1.30900 | 9.659e-01 | 2.588e-01 |
| 1.36136 | 9.781e-01 | 2.079e-01 |
| 1.41372 | 9.877e-01 | 1.564e-01 |
| 1.46608 | 9.945e-01 | 1.045e-01 |
| 1.51844 | 9.986e-01 | 5.234e-02 |
| 1.57080 | 1.000e+00 | 1.225e-16 |
| 1.62316 | 9.986e-01 | -5.234e-02 |
| 1.67552 | 9.945e-01 | -1.045e-01 |
| 1.72788 | 9.877e-01 | -1.564e-01 |
| 1.78024 | 9.781e-01 | -2.079e-01 |
| 1.83260 | 9.659e-01 | -2.588e-01 |
| 1.88496 | 9.511e-01 | -3.090e-01 |
| 1.93732 | 9.336e-01 | -3.584e-01 |
| 1.98968 | 9.135e-01 | -4.067e-01 |
| 2.04204 | 8.910e-01 | -4.540e-01 |
| 2.09440 | 8.660e-01 | -5.000e-01 |
| 2.14675 | 8.387e-01 | -5.446e-01 |
| 2.19911 | 8.090e-01 | -5.878e-01 |
| 2.25147 | 7.771e-01 | -6.293e-01 |
| 2.30383 | 7.431e-01 | -6.691e-01 |
| 2.35619 | 7.071e-01 | -7.071e-01 |
| 2.40855 | 6.691e-01 | -7.431e-01 |
| 2.46091 | 6.293e-01 | -7.771e-01 |
| 2.51327 | 5.878e-01 | -8.090e-01 |
| 2.56563 | 5.446e-01 | -8.387e-01 |
| 2.61799 | 5.000e-01 | -8.660e-01 |
| 2.67035 | 4.540e-01 | -8.910e-01 |
| 2.72271 | 4.067e-01 | -9.135e-01 |
| 2.77507 | 3.584e-01 | -9.336e-01 |
| 2.82743 | 3.090e-01 | -9.511e-01 |
| 2.87979 | 2.588e-01 | -9.659e-01 |
| 2.93215 | 2.079e-01 | -9.781e-01 |
| 2.98451 | 1.564e-01 | -9.877e-01 |
| 3.03687 | 1.045e-01 | -9.945e-01 |
| 3.08923 | 5.234e-02 | -9.986e-01 |
| 3.14159 | 5.666e-16 | -1.000e+00 |
| 3.19395 | -5.234e-02 | -9.986e-01 |
| 3.24631 | -1.045e-01 | -9.945e-01 |
| 3.29867 | -1.564e-01 | -9.877e-01 |
| 3.35103 | -2.079e-01 | -9.781e-01 |
| 3.40339 | -2.588e-01 | -9.659e-01 |
| 3.45575 | -3.090e-01 | -9.511e-01 |
| 3.50811 | -3.584e-01 | -9.336e-01 |
| 3.56047 | -4.067e-01 | -9.135e-01 |
| 3.61283 | -4.540e-01 | -8.910e-01 |
| 3.66519 | -5.000e-01 | -8.660e-01 |
| 3.71755 | -5.446e-01 | -8.387e-01 |
| 3.76991 | -5.878e-01 | -8.090e-01 |
| 3.82227 | -6.293e-01 | -7.771e-01 |
| 3.87463 | -6.691e-01 | -7.431e-01 |
| 3.92699 | -7.071e-01 | -7.071e-01 |
| 3.97935 | -7.431e-01 | -6.691e-01 |
| 4.03171 | -7.771e-01 | -6.293e-01 |
| 4.08407 | -8.090e-01 | -5.878e-01 |
| 4.13643 | -8.387e-01 | -5.446e-01 |
| 4.18879 | -8.660e-01 | -5.000e-01 |
| 4.24115 | -8.910e-01 | -4.540e-01 |
| 4.29351 | -9.135e-01 | -4.067e-01 |
| 4.34587 | -9.336e-01 | -3.584e-01 |
| 4.39823 | -9.511e-01 | -3.090e-01 |
| 4.45059 | -9.659e-01 | -2.588e-01 |
| 4.50295 | -9.781e-01 | -2.079e-01 |
| 4.55531 | -9.877e-01 | -1.564e-01 |
| 4.60767 | -9.945e-01 | -1.045e-01 |
| 4.66003 | -9.986e-01 | -5.234e-02 |
| 4.71239 | -1.000e+00 | -2.449e-16 |
| 4.76475 | -9.986e-01 | 5.234e-02 |
| 4.81711 | -9.945e-01 | 1.045e-01 |
| 4.86947 | -9.877e-01 | 1.564e-01 |
| 4.92183 | -9.781e-01 | 2.079e-01 |
| 4.97419 | -9.659e-01 | 2.588e-01 |
| 5.02655 | -9.511e-01 | 3.090e-01 |
| 5.07891 | -9.336e-01 | 3.584e-01 |
| 5.13127 | -9.135e-01 | 4.067e-01 |
| 5.18363 | -8.910e-01 | 4.540e-01 |
| 5.23599 | -8.660e-01 | 5.000e-01 |
| 5.28835 | -8.387e-01 | 5.446e-01 |
| 5.34071 | -8.090e-01 | 5.878e-01 |
| 5.39307 | -7.771e-01 | 6.293e-01 |
| 5.44543 | -7.431e-01 | 6.691e-01 |
| 5.49779 | -7.071e-01 | 7.071e-01 |
| 5.55015 | -6.691e-01 | 7.431e-01 |
| 5.60251 | -6.293e-01 | 7.771e-01 |
| 5.65487 | -5.878e-01 | 8.090e-01 |
| 5.70723 | -5.446e-01 | 8.387e-01 |
| 5.75959 | -5.000e-01 | 8.660e-01 |
| 5.81195 | -4.540e-01 | 8.910e-01 |
| 5.86431 | -4.067e-01 | 9.135e-01 |
| 5.91667 | -3.584e-01 | 9.336e-01 |
| 5.96903 | -3.090e-01 | 9.511e-01 |
| 6.02139 | -2.588e-01 | 9.659e-01 |
| 6.07375 | -2.079e-01 | 9.781e-01 |
| 6.12611 | -1.564e-01 | 9.877e-01 |
| 6.17847 | -1.045e-01 | 9.945e-01 |
| 6.23083 | -5.234e-02 | 9.986e-01 |
| 6.28319 | -1.133e-15 | 1.000e+00 |
In this graph, wave 2 reaches its maximum a quarter of a period before wave 1. Wave 2 leads wave 1 by π/2; wave 1 lags wave 2 by π/2.
Finding a phase difference from a graph
A phase difference is a fraction of a cycle, so find what fraction of a cycle separates the two oscillations, then multiply by 2π:
- two particles a distance Δ x apart on one wave, at one instant: Δφ = (Δ x)/λ × 2π;
- one particle at two times, or two oscillations on one displacement–time graph, separated by a time Δ t: Δφ = (Δ t)/T × 2π.
On a progressive wave, the oscillation reaches the particle nearer the source first, so that particle leads. Particles one whole wavelength apart are in phase; particles half a wavelength apart are in antiphase.
Adding or removing a whole cycle changes nothing, so subtract 2π until the phase difference lies between 0 and 2π. If a question asks for the smallest phase difference and your answer is more than π, subtract it from 2π: going round the cycle the other way is shorter. Reverse the lead/lag description when using that complementary angle: leading by 3π/2 is equivalent to lagging by π/2.
Worked example 1
Speed and phase from two graphs
Worked example 1
Speed and phase from two graphs
A displacement–distance graph of a wave shows a wavelength of 0.80 m. A displacement–time graph for one point on the wave shows successive crests 0.25 s apart. Find the wave speed and the phase difference between two points 0.30 m apart along the wave.
Show full solution
Read each cycle from its own graph
Method
Take the wavelength from the distance graph and the period from the time graph.Reason
Crest spacing is a wavelength only along distance and a period only along time.Working
Answer
λ = 0.80 m and T = 0.25 s, so f = 1/T = 4.0 Hz.
Find the speed
Reason
The pattern moves one wavelength in each period.Working
Answer
v = fλ = (4.0)(0.80) = 3.2 m s⁻¹
Convert the separation to phase
Working
Answer
The separation is 0.30/0.80 of a cycle, so
Δφ = (0.30/0.80)(2π)This gives 0.75π rad, or 135°.
Quick check
The points are less than half a wavelength apart, so the phase difference must be less than π. It is.
Check your understanding 2
Find phase difference from crest timings
Check your understanding 2
Find phase difference from crest timings
A displacement–time graph shows two oscillations of period 8.0 ms. Oscillation P reaches a crest at t = 2.0 ms and oscillation Q reaches its next crest at t = 5.0 ms. Find the phase difference, and say which oscillation leads.
Show the steps Optional working
Show answer
Δ t = 3.0 ms, so Δφ = 3.0/8.0 × 2π = 3π/4 rad. P reaches its crest first, so P leads Q by 3π/4.
Check your understanding 3
Find the smallest phase difference between points
Check your understanding 3
Find the smallest phase difference between points
Two points on a wave are 0.75λ apart. What is the smallest phase difference between them?
Show answer
0.75 × 2π = 3π/2 rad. Going round the cycle the other way, the same pair of oscillations differ by 2π-3π/2 = π/2 rad, so the smallest phase difference is π/2. The point nearer the source leads by 3π/2, which is the same as lagging by π/2.
Guided practice 1
Phase difference in a sound wave
Guided practice 1
Phase difference in a sound wave
The centres of neighbouring compressions in a sound wave are 0.45 m apart, and the frequency is 8.0 × 10² Hz. Find the speed of the wave and the phase difference between two air particles 0.15 m apart along the direction of travel.
Find the speed and the phase difference
Show the steps Optional working
Hint 1
what is one wavelength here?
What spacing marks one complete cycle in this sound wave?
Hint 2
fraction of a cycle
0.15 m is what fraction of 0.45 m?
Show solution step by step
Find the speed
Reason
Compressions are one wavelength apart, so λ = 0.45 m.Working
Answer
v = fλ = (800)(0.45) = 360 m s⁻¹
Find the phase difference
Working
Answer
The particle separation is one-third of a wavelength:
Δφ = (0.15/0.45)(2π)This is 2π/3 = 2.09 rad, or 120°.
Quick check
0.15 m is a third of the wavelength, so the phase difference is a third of a cycle, 120°.
Try it yourself 1
Which point leads?
Try it yourself 1
Which point leads?
A wave of frequency 4.0 Hz travels at 3.2 m s⁻¹ along a rope, passing point P and then point Q, 1.0 m further on. Find the smallest phase difference between the oscillations at P and Q, and state which point leads.
Find the phase difference
Show the steps Optional working
Hint 1
find the wavelength
Use λ = v/f. How many wavelengths is 1.0 m?
Hint 2
remove whole cycles
Whole wavelengths of separation leave the oscillations in phase, so only the part left over matters.
Show solution step by step
Find the wavelength
Reason
The phase difference depends on the separation as a fraction of a wavelength.Working
Answer
Use λ = v/f:
λ = 3.2/4.0 = 0.80 mThe separation is 1.0/0.80 = 1.25 wavelengths.
Remove the whole cycle and decide the lead
Working
Answer
1.25 cycles is one whole cycle plus 0.25 of a cycle. Removing the whole cycle gives
Δφ = π/2 = 1.57 radThe wave reaches P first, so P leads Q by π/2.
Quick check
A phase difference of 1.25 cycles looks the same as 0.25 cycles, because whole cycles cannot be seen in the motion.
Explaining wave graphs in an exam
Exam-style question 1
An unlabelled wave graph
Exam-style question 1
An unlabelled wave graph
A student is given a sinusoidal wave graph with no axis labels and says that the spacing of its peaks is the wavelength.
(a) Explain what must be known before this conclusion is valid, and what the spacing would be otherwise. [2 marks]
(b) Describe how a displacement–distance graph and a displacement–time graph of the same wave can be used to find the wave speed and the phase difference between two points on the wave. [4 marks]
Write your answer before viewing the mark scheme
Show solution step by step
Identify the graph
2 marksMethod
Say which quantity is on the horizontal axis.Reason
The same sinusoid can be a snapshot in space or a record in time.Working
Answer
The peak spacing is the wavelength only if the graph shows displacement against distance at one instant. If it shows displacement against time at one position, the spacing is the period.
Find speed and phase
4 marksWorking
Answer
Read λ from the displacement–distance graph and T from the displacement–time graph. Then f = 1/T and v = fλ. For two points a distance Δ x apart, the phase difference is Δφ = 2πΔ x/λ.
Self-mark with the mark scheme
Tick each mark point that your answer includes.
Tick each point only if your answer states it clearly.
Common mistake
Reading a period from a displacement–distance graph loses marks: each graph gives only one of λ and T.
Common mistakes
- Reading a wavelength from a displacement–time graph, or a period from a displacement–distance graph.
- Confusing the wave speed with the speed of the particles. The pattern moves at a steady v = fλ; each particle speeds up and slows down as it oscillates.
- Quoting a phase difference without saying which oscillation leads, when the question asks.
- Using 2πΔ x/λ for two oscillations shown on a time graph. A time separation needs 2πΔ t/T.
- Calling the peaks of a longitudinal displacement graph compressions. Compressions are where the graph slopes most steeply downwards.
Before you move on
Check your understanding 4
Relate crest motion to marker oscillation
Check your understanding 4
Relate crest motion to marker oscillation
A wave crest travels 3.6 m in 0.30 s. A floating marker completes one oscillation every 0.20 s and returns to its starting position each cycle. Find the wave speed, wavelength and smallest phase difference between two markers 0.60 m apart along the wave. Does the crest’s speed describe the marker’s net motion?
Show answer
The wave speed is 3.6/0.30 = 12 m s⁻¹. The marker’s period is 0.20 s, so λ = vT = 12(0.20) = 2.4 m. The separation is one-quarter of a wavelength, giving a phase difference of 2π(0.60/2.4) = π/2 rad. The crest carries the wave pattern along; the marker oscillates and has zero net displacement over each cycle, so 12 m s⁻¹ is not its net velocity.
Loading reading progress…
Spotted an error? Report a correction