Enzymes and rate data
Compare enzyme activity at different temperatures and pH values, and distinguish the best tested condition from the exact optimum.
On this page
Digestion · about 25–35 min
What you need to understand
The highest measured rate identifies the best tested condition. More closely spaced tests are needed to estimate the exact optimum.
Definitions
- enzyme
a substance that speeds a biological reaction without being used up
For example: Digestive enzymes help break large food molecules into smaller, absorbable ones.- optimum
the condition at which an enzyme works at its greatest rate, with other relevant conditions fixed
For example: An optimum pH is the pH at which that enzyme works fastest. A sparse set of tests may not locate it exactly.
Key idea
- LookRates at pH 3, 5, 7 and 9 are 2, 7, 5 and 1 units/min.
- ThinkUse the maximum measured rate and name the condition at that data point.
- DoRead the maximum rate from a graph and distinguish reduced activity from a claim that every enzyme has the same optimum.
Review the full digestion topic picture
Explanation
Enzymes and the conditions they need
An enzyme is a biological catalyst: it speeds up a reaction without being used up in that reaction. Digestive enzymes help convert large food molecules into smaller ones. The substance an enzyme acts on is called its substrate. You can interpret the data in this lesson without memorising enzyme or substrate names.
At low temperatures, enzyme-controlled reactions are slow. Warming can speed them up, but sufficiently high temperatures can change an enzyme’s structure so that it no longer works properly. This is called denaturation. A change in pH can also reduce activity. Different enzymes have different optimum conditions; they do not all work best at the same pH or temperature.
Find the best tested condition
Read both axes. Find the highest measured rate, then read its matching temperature or pH. In the illustrative graph below, compare the four points. There is no curve between them because those intermediate pH values were not tested.
Enzyme activity at four tested pH values
The horizontal axis shows pH from 2 to 10. The vertical axis shows average digestion rate from 0 to 8 units/min. Points are pH 3, rate 2; pH 5, rate 7; pH 7, rate 5; and pH 9, rate 1.
Scroll across the graph to read all labels.


View figure data
| pH (no unit) | Average digestion rate / units/min |
|---|---|
| 3 | 2 |
| 5 | 7 |
| 7 | 5 |
| 9 | 1 |
The highest measured rate is 7 units/min at pH 5. Therefore pH 5 is the best tested condition, sometimes called the measured optimum. The true optimum could lie between tested values. Test smaller pH intervals around 5, with repeats, to estimate it more precisely. A drawn smooth curve would not provide new measurements.
Compare rates fairly
Average rate = amount of product formed ÷ time taken. For example, producing 12 units in 4 minutes gives 12 ÷ 4 = 3 units/min. “Units” here means the supplied scale for product amount. Always include the time unit, and compare rates in the same units.
Another method times how long a reaction takes to reach a fixed endpoint, such as the same amount of substrate being broken down. When that amount is the same in every test, a shorter time means a faster average rate. The index 1 ÷ time is proportional to that average rate: it is useful for comparison, but does not itself measure an amount of product. With time in seconds, the index has the unit s⁻¹, meaning “per second”.
Pause and say it: Find the highest measured rate, or the shortest time for the same endpoint. Name the best tested condition and keep the conclusion within the evidence.
Common mistake
Tempting wrong idea: If 40 °C gives the highest measured rate, the enzyme’s exact optimum must be 40 °C.
Why it fails: The highest measured rate identifies the best of the conditions tested. If the temperatures are widely spaced, the true maximum may lie between them.
Use this instead: State the best tested condition, then suggest testing more closely spaced values around it to estimate the optimum.
Practical work
What to show: Read the maximum rate from a graph and distinguish reduced activity from a claim that every enzyme has the same optimum.
Before you finish: The result rejects the claim that hotter is always faster.
Practical: Enzyme-rate data investigation
How does temperature affect an enzyme-controlled breakdown?
Safety: For practical work, follow your teacher’s approved method, wear eye protection and take care with hot water. You can investigate the supplied data without handling chemicals or biological materials.
- Change
- temperature
- Measure
- time to the same endpoint; use 1/time as a rate index
- Keep the same
pH; enzyme concentration and volume; substrate concentration and volume; endpoint and mixing method
View the apparatus, method and sample results
Apparatus
For a teacher-supervised experiment: prepared enzyme and substrate, water baths, thermometer and stopwatch, plus the indicator and equipment specified in the approved method. For a data-only investigation, use the supplied table and graph.
Method
Set water baths to at least four measured temperatures.
Allow equal enzyme and substrate portions to reach each temperature.
Mix and start timing consistently.
Use the same endpoint in every trial. Record its time and, if instructed, calculate the comparison index 1/time in s⁻¹.
Repeat at each temperature. Compare the mean endpoint times, or calculate 1/mean time as a rate index and plot it against temperature. State which quantity your graph shows.
| Temperature / °C | Mean time / s | Rate index, 1/time / s⁻¹ |
|---|---|---|
| 20 | 120 | 0.0083 |
| 30 | 70 | 0.014 |
| 40 | 45 | 0.022 |
| 60 | 150 | 0.0067 |
Limitation: Manual endpoint judgement and mixing time affect results.
Improvement: Agree on a clear endpoint and use the same mixing and timing procedure in each trial. Repeat to check consistency. An approved sensor can help if it measures the change being investigated.
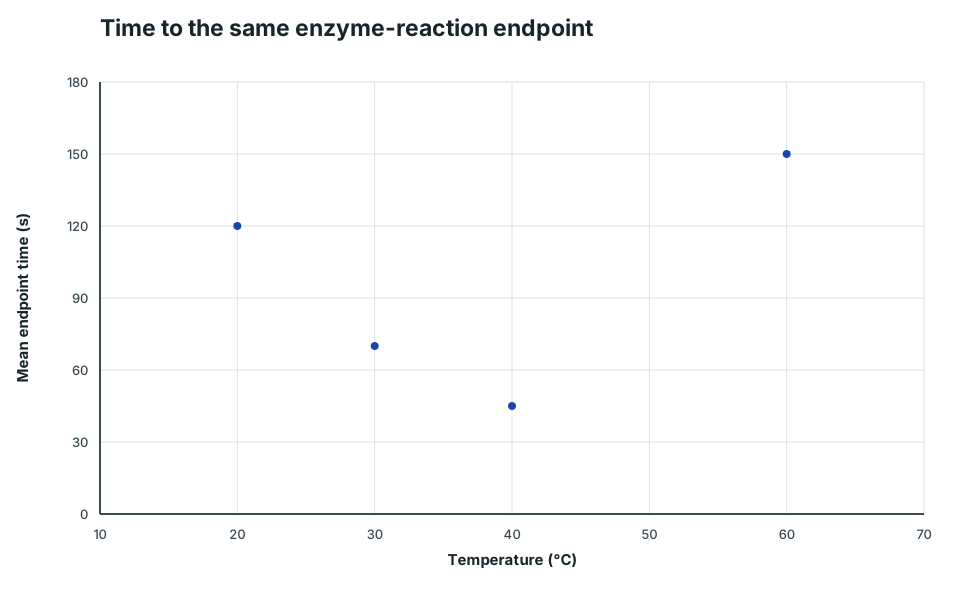
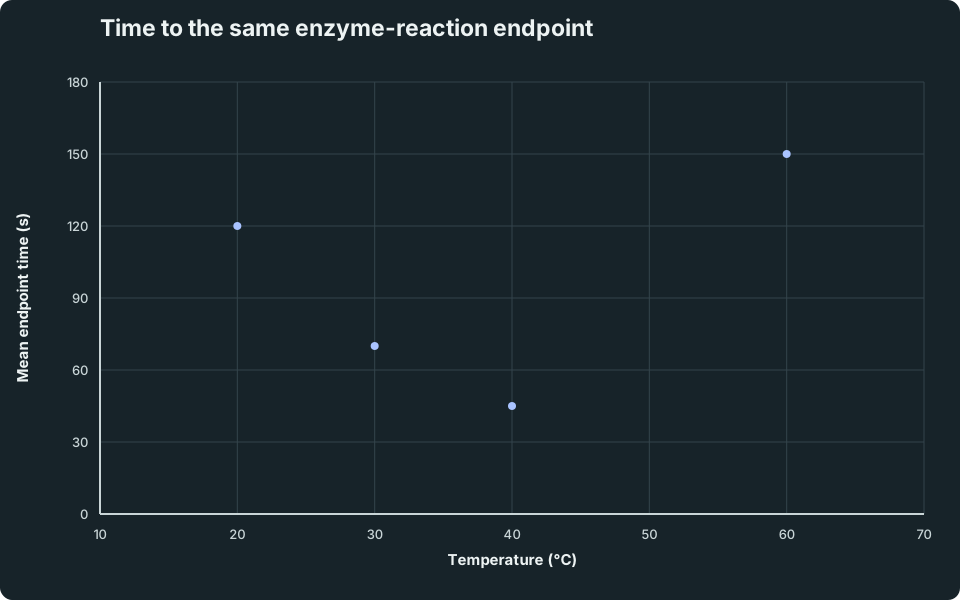
Time to the same enzyme-reaction endpoint
Temperature in degrees Celsius runs horizontally from 10 to 70. Mean time to the same endpoint in seconds runs vertically from 0 to 180. Points are 20 degrees, 120 seconds; 30 degrees, 70 seconds; 40 degrees, 45 seconds; and 60 degrees, 150 seconds.
Scroll across the graph to read all labels.
View figure data
| Temperature (°C) | Mean endpoint time / s |
|---|---|
| 20 | 120 |
| 30 | 70 |
| 40 | 45 |
| 60 | 150 |
Here the vertical axis shows time, so the lowest point gives the fastest tested reaction: 45 s at 40 °C. The longer time at 60 °C shows that “hotter is always faster” fails for these data. The four points do not establish an exact optimum temperature or prove why the activity fell.
6. Worked Examples
Modelled example 1
Identify the best tested pH
Problem
Rates at pH 3, 5, 7 and 9 are 2, 7, 5 and 1 units/min. Which pH gives the highest measured rate? Does this locate the exact optimum?
Study the worked solution
Reason from the evidence
Method
Find the greatest measured rate, then read the pH paired with that value.
Reason
Use the maximum measured rate and name the condition at that data point.
Working
- Compare rates, not pH values alone.
- The maximum measured rate is 7 units/min.
- This occurs at pH 5.
State the conclusion
Working
pH 5 is the best tested condition. The exact optimum may lie between the tested values, so more closely spaced measurements are needed.
Guided practice 2
Compare two enzyme conditions
Problem
An enzyme produces 18 units of product in 6 minutes at 30 °C and 32 units in 8 minutes at 40 °C. Calculate each average rate and identify the faster tested condition.
Calculate both rates in the same unit
Hints
Hint 1: relationship
average rate = amount of product ÷ time
Hint 2: compare fairly
Do not compare the product amounts until you have accounted for the different times.
View solution step by step
Calculate both rates
Method
Divide product by time for each condition.Reason
Rates allow a fair comparison when test durations differ.
Working
30 °C: 18 ÷ 6 = 3 units/min; 40 °C: 32 ÷ 8 = 4 units/min
Limit the conclusion
Method
Identify only the faster of the two conditions that were tested.
Reason
Two results cannot locate the maximum across all possible temperatures.
Working
40 °C is faster among these two tested conditions. This does not prove that 40 °C is the exact optimum because other temperatures were not tested.
Common misconception 3
A highest tested value is not an exact optimum
Learner response
Rates at 20, 30 and 40 °C are 2, 5 and 4 units/min. A learner states, “The enzyme’s exact optimum is 30 °C.” Evaluate the statement.
Keep the evidence and conclusion in proportion
View solution step by step
State only what was measured
Method
Identify the best tested condition, then describe the uncertainty.
Reason
The true maximum might lie between the widely spaced temperatures.
Working
30 °C gave the highest measured rate, so it is the best of the tested values. The exact optimum is not known without testing more temperatures, especially between 20 and 40 °C.
Examiner practice 4
Use data and improve the investigation
Practice question
At pH 6, an enzyme produces 45 units of product in 9 minutes. Calculate its average rate. The highest measured rate in tests at pH 4, 6 and 8 occurs at pH 6. Suggest how to obtain a more precise estimate of the optimum pH. [4 marks]
Show the rate and a controlled improvement
View solution step by step
Calculate the rate
2 marksMethod
Divide the product amount by the reaction time.Reason
Average rate describes product formed per minute.Working
average rate = 45 ÷ 9 = 5 units/minImprove the pH search
2 marksMethod
Test more closely spaced pH values around 6 while keeping other variables controlled.
Reason
The current two-unit intervals may hide a maximum between measurements.
Working
For example, test pH 5.0, 5.5, 6.0, 6.5 and 7.0 at the same temperature and enzyme concentration, then compare repeated mean rates.
Self-mark with the mark scheme
Compare your response with each mark point. Select a point only when your response contains that evidence.
Credit both data handling and investigation design.
Challenge 5
Explain a rise and fall in enzyme rate
Problem
At 15, 25, 35, 45 and 55 °C, an enzyme’s rates are 1, 3, 7, 4 and 0 units/min. Describe the complete pattern, identify the best tested temperature and explain why “higher temperature always gives a faster rate” is not supported.
Describe first, then explain
Hints
Hint 1: pattern
Use both “increases” and “decreases”.
Hint 2: evidence
Compare the rates above 35 °C with the rate at 35 °C.
View solution step by step
Connect pattern and conclusion
Method
State the rise to a maximum and the fall after it.
Reason
The data above the maximum directly test the claim that every temperature increase makes the enzyme faster.
Working
The rate increases from 1 to 7 units/min between 15 and 35 °C, then decreases to 0 units/min by 55 °C. The best tested temperature is 35 °C. The lower rates at 45 and 55 °C show that increasing temperature beyond this point does not keep increasing activity.
Guided practice
Try it with support
An enzyme has rates 2, 7, 5 and 1 units/min at pH 3, 5, 7 and 9. State the best tested pH and explain what remains uncertain.
Find the highest measured rate.
Do not claim an untested value.
Check the guided answer
Answer: The highest measured rate is 7 units/min at pH 5, so pH 5 is the best of the tested values. This does not establish the exact optimum pH.
Check: The exact optimum could lie between tested pH values.
Practise and continue
Practise this
For the same endpoint, times are 100 s, 50 s and 80 s at 20 °C, 40 °C and 60 °C. Which tested temperature gives the fastest rate?
Need a hint?
A shorter time means a faster rate when the endpoint is fixed.
Check your answer
Answer: 40 °C gives the fastest tested rate because its endpoint time, 50 s, is the shortest.
Check: The result rejects the claim that hotter is always faster.
Think like a scientist
Why should pH, enzyme concentration and substrate amount be controlled in a temperature investigation?
Check the reasoning
Keeping them constant isolates temperature as the intended cause of rate differences.
Remember: Repeats address random variation; controls address fairness.
One-minute check
How do you identify the best tested condition from a rate graph? Why might the exact optimum still be uncertain?
For the same endpoint, why does a shorter time give a larger rate index, 1/time?
Explain why increasing temperature does not always make an enzyme-controlled reaction faster.
Syllabus and review details
- SEC G1 Science 2027 · 2027
Content structure and syllabus content, PDF pages 8–17
Last reviewed: