Distance–time and speed–time graphs
Key idea: A distance–time gradient gives speed. On a speed–time graph, the gradient gives acceleration and the area under the line gives distance travelled.
Offline pages
Saved on this device only. Connect at least once every 30 days to confirm Premium. Sign-out or a change of account removes saved copies.
Loading guide controls…
Guided lessons · coming soon
Guided lesson
Guided steps
- Read axes and scales before describing the motion.
- Draw the walker’s graph and explain each change.
- Compare walking gradients with the horizontal rest section.
- Compare changing speeds even when average speeds agree.
- Find the first error, then calculate both speeds.
- Find acceleration from the gradient and name the motion.
- Follow successive speed changes and the later steady section.
- Describe every section using its vertical quantity.
- Find acceleration and distance from gradients and areas.
- Split the area under the graph into a rectangle and a triangle.
- Match speed to distance-time gradient and check total distance.
- Plot the runner’s graph, then find acceleration and total distance.
- Use each vertical axis to find motion and added distance.
- Explain what stays constant on each horizontal graph.
On this page
You stopped at:
ContinueA graph shows a whole journey at a glance: when an object was at rest, when it moved steadily and when it sped up or slowed down. A distance–time graph gives the speed from its gradient, the change up the graph divided by the change along it. A speed–time graph gives the acceleration from its gradient and the distance travelled from the area under it. Every graph here describes motion in one direction.
Plot a motion graph from a data table
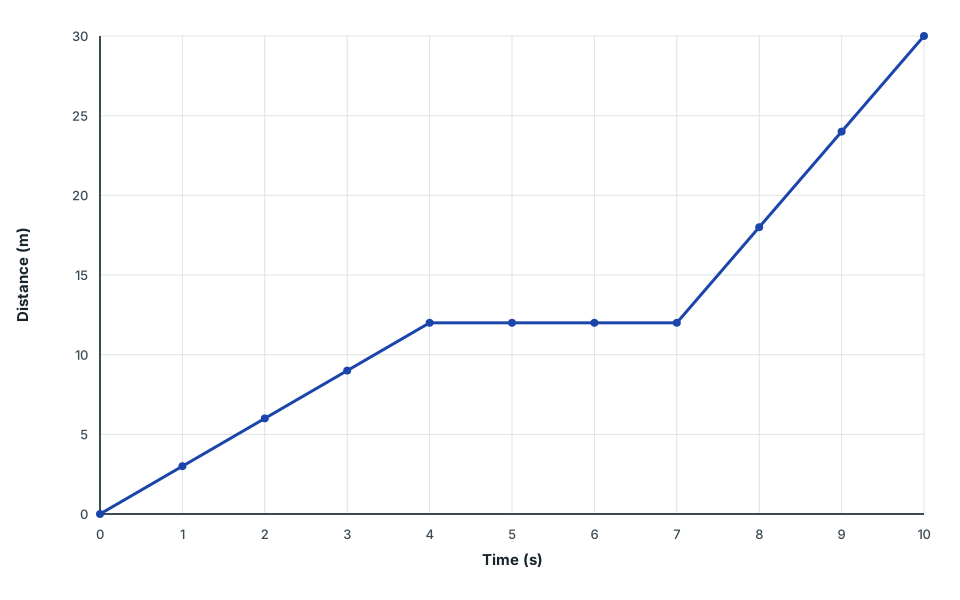
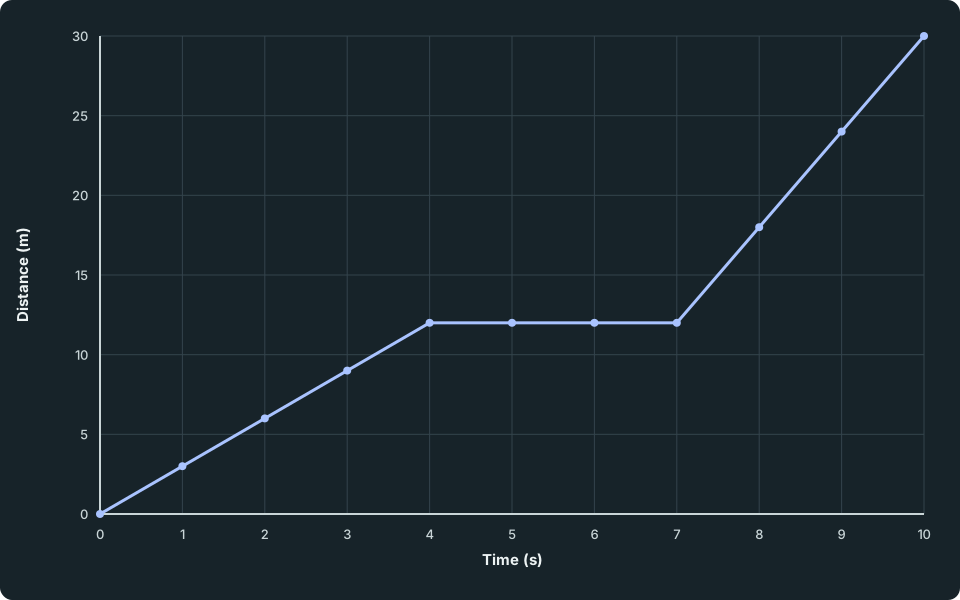
This table models a walker moving at a steady speed from 0–4 s, resting from 4–7 s, then walking at a greater steady speed from 7–10 s. The distance from the start is shown every second.
| time / s | 0 | 1 | 2 | 3 | 4 | 5 | 6 | 7 | 8 | 9 | 10 |
|---|---|---|---|---|---|---|---|---|---|---|---|
| distance / m | 0 | 3 | 6 | 9 | 12 | 12 | 12 | 12 | 18 | 24 | 30 |
- Put time on the horizontal axis and the measured quantity, here distance, on the vertical axis.
- Label each axis with the quantity and its unit: time / s and distance / m.
- Choose a simple scale that uses most of the grid: 1 s per division across (0 to 10 s) and 5 m per division up (0 to 30 m).
- Plot every point accurately, then join the points. In this example, each section has a stated steady speed or rest, so use straight lines. For real measurements, choose the line or curve that fits the trend rather than assuming the motion between readings.
Distance–time graph of a walk
Distance in m against time in s from 0 s to 10 s. The points rise in a straight line from 0 m at 0 s to 12 m at 4 s, stay at 12 m from 4 s to 7 s, then rise in a steeper straight line to 30 m at 10 s. The data table lists every point.
Scroll across the figure to read all labels.
View figure data
| Time (s) | Walker |
|---|---|
| 0 | 0 |
| 1 | 3 |
| 2 | 6 |
| 3 | 9 |
| 4 | 12 |
| 5 | 12 |
| 6 | 12 |
| 7 | 12 |
| 8 | 18 |
| 9 | 24 |
| 10 | 30 |
A motion graph is not a picture of the route. The walk was along a straight path; the graph’s shape shows how the distance changed with time.
Check your understanding 1 Construct and explain a distance–time graph
Use the walker’s data above to draw a distance–time graph on paper. Choose and label your scales, plot every point and join the stated steady-motion sections. Record the coordinates where the motion changes, then explain how your graph shows rest and the faster stage. Compare your plot with the public graph after committing to your own construction.
Show answer
Use time / s horizontally and distance / m vertically, with consistent scales covering 0–10 s and 0–30 m. Plot every table point. The changes are at (4 s, 12 m) and (7 s, 12 m). Join (0, 0) to (4, 12), draw a horizontal section to (7, 12), then a steeper straight section to (10, 30). The horizontal section means no added distance; the last section has the larger gradient. Compare the plotted positions and scales against the supplied graph. Use these criteria to review your own drawing.
Distance–time graphs
On a distance–time graph, the gradient is the speed: the change in distance divided by the time taken. The height of the line is the distance travelled so far, not the speed.
| Shape of the distance–time graph | Motion |
|---|---|
| horizontal line | at rest: the distance does not change |
| straight sloping line | uniform (steady) speed |
| curve getting steeper | non-uniform speed: speeding up |
| curve getting less steep | non-uniform speed: slowing down |
A steeper straight line means a greater speed.
Reading the walker’s graph
- 0–4 s: a straight rising line, so the speed is uniform. Gradient = 12 ÷ 4 = 3.0 m/s.
- 4–7 s: the line is horizontal. The distance stays at 12 m, so the walker is at rest.
- 7–10 s: a steeper straight line. Gradient = (30 - 12) ÷ (10 - 7) = 18 ÷ 3 = 6.0 m/s.
At 6 s the walker is 12 m from the start but not moving. The graph never slopes downwards: in one direction, distance travelled can only stay the same or increase.
Curved distance–time graphs
When the speed changes, the distance–time graph curves.
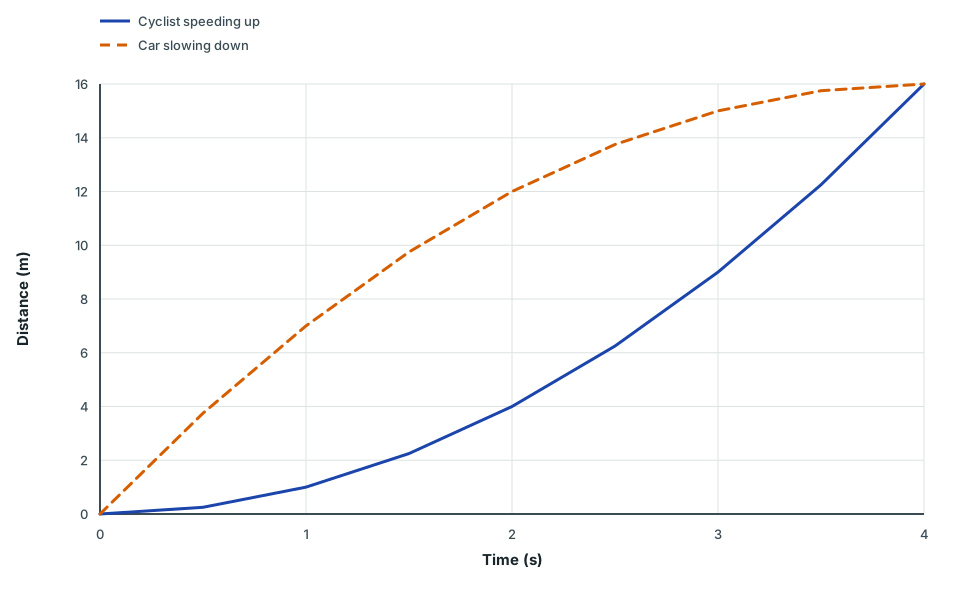
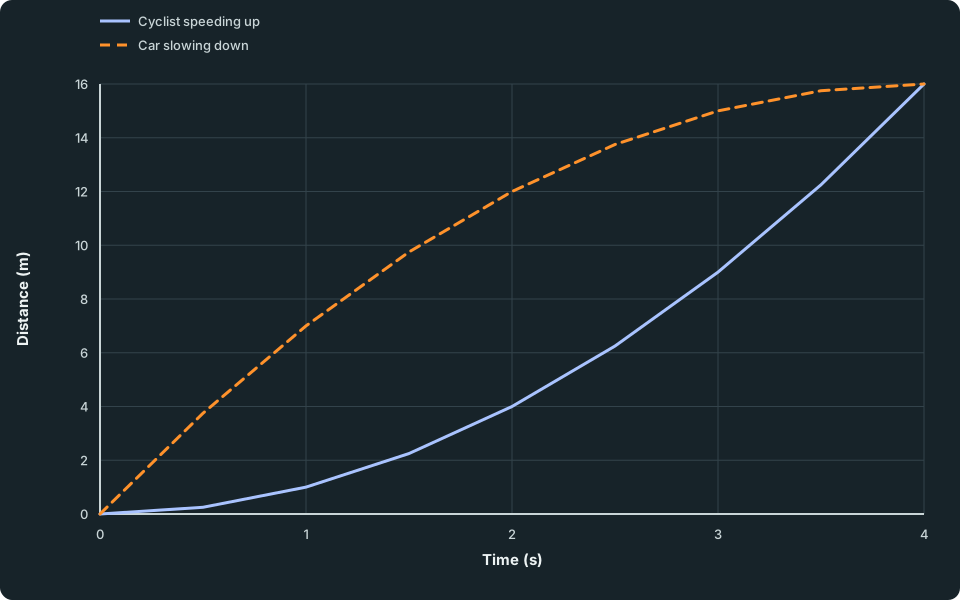
Two curved distance–time graphs
Distance in m against time in s from 0 s to 4 s. The cyclist's curve starts flat and gets steeper, passing 1 m at 1 s, 4 m at 2 s, 9 m at 3 s and 16 m at 4 s. The car's curve starts steep and gets less steep, passing 7 m at 1 s, 12 m at 2 s, 15 m at 3 s and 16 m at 4 s, where it is level. The data table lists every point.
Scroll across the figure to read all labels.
View figure data
| Time (s) | Cyclist speeding up | Car slowing down |
|---|---|---|
| 0.0 | 0.00 | 0.00 |
| 0.5 | 0.25 | 3.75 |
| 1.0 | 1.00 | 7.00 |
| 1.5 | 2.25 | 9.75 |
| 2.0 | 4.00 | 12.00 |
| 2.5 | 6.25 | 13.75 |
| 3.0 | 9.00 | 15.00 |
| 3.5 | 12.25 | 15.75 |
| 4.0 | 16.00 | 16.00 |
- Cyclist (solid line). In each second it travels 1 m, then 3 m, then 5 m, then 7 m. The curve gets steeper, so the cyclist is speeding up.
- Car (dashed line). In each second it travels 7 m, then 5 m, then 3 m, then 1 m. The curve gets less steep, so the car is slowing down. At 4 s the curve is level: the car has stopped.
Both travel 16 m in 4.0 s, so both have an average speed of 16 ÷ 4.0 = 4.0 m/s. The shape of the graph shows what the average hides.
Check your understanding 2
Using the walker’s graph, a learner writes: “At 6 s the line is at 12, so the speed is 12 m/s. From 0 s to 7 s the average speed is 12 ÷ 4 = 3 m/s.” Find the first incorrect step, then give both correct speeds.
Show answer
The first error is treating the height of the graph as speed: the vertical axis is distance in metres. At 6 s the line is horizontal, so the distance is not changing and the speed is 0 m/s. The average speed from 0 s to 7 s must include the 3 s at rest: 12 ÷ 7 = 1.7 m/s. The value 12 ÷ 4 = 3.0 m/s is the speed during the first 4 s only.
Speed–time graphs and distance
On a speed–time graph the vertical axis gives the speed directly. Its height tells you how fast the object is moving, and its gradient is the acceleration.
| Shape of the speed–time graph | Motion |
|---|---|
| line along the time axis | at rest |
| horizontal line above the axis | uniform speed |
| straight sloping line | uniform acceleration |
| curve | non-uniform acceleration |
A straight line sloping down shows uniform deceleration.
Check your understanding 3
A speed–time line rises in a straight line from 2 m/s to 11 m/s in 3 s. Calculate the acceleration and name the type of motion.
Show the steps Optional working
Show answer
(11 - 2) ÷ 3 = 3.0 m/s². A straight sloping line shows uniform acceleration.
Reading a curved speed–time graph
Speed–time graph of a car pulling away
Speed in m/s against time in s from 0 s to 6 s. The curve rises from 0 m/s at 0 s through 7 m/s at 1 s, 12 m/s at 2 s and 15 m/s at 3 s, getting less steep, and levels off at 16 m/s at 4 s. It stays horizontal at 16 m/s until 6 s. The data table lists every point.
Scroll across the figure to read all labels.


View figure data
| Time (s) | Car |
|---|---|
| 0.0 | 0.00 |
| 0.5 | 3.75 |
| 1.0 | 7.00 |
| 1.5 | 9.75 |
| 2.0 | 12.00 |
| 2.5 | 13.75 |
| 3.0 | 15.00 |
| 3.5 | 15.75 |
| 4.0 | 16.00 |
| 5.0 | 16.00 |
| 6.0 | 16.00 |
This car is pulling away from traffic lights.
- Read speeds from the height: 7 m/s at 1 s, 12 m/s at 2 s, 15 m/s at 3 s, 16 m/s at 4 s.
- The speed rises by 7, 5, 3 and then 1 m/s in successive seconds. The curve gets less steep, so the acceleration is non-uniform and decreasing.
- From 4 s to 6 s the line is horizontal: the car moves at a uniform speed of 16 m/s.
Check your understanding 4
Describe the motion in each section. (a) A distance–time graph is a straight sloping line from 0 s to 5 s, then gets less steep until it is horizontal from 9 s. (b) A speed–time graph is horizontal at 6 m/s from 0 s to 3 s, then curves upwards, getting steeper.
Show answer
(a) Uniform speed from 0 s to 5 s; non-uniform speed, slowing down, from 5 s to 9 s; at rest from 9 s. (b) Uniform speed of 6 m/s from 0 s to 3 s; then speeding up with an increasing acceleration, which is non-uniform acceleration.
The area under a speed–time graph is the distance travelled
For a steady speed, distance = speed × time. On a speed–time graph that product is the area of a rectangle: height (speed) times width (time). The same idea works for uniform acceleration, where the area is a triangle or a trapezium.
- Split the region between the line and the time axis into rectangles and triangles.
- Rectangle: area = speed × time. Triangle: area = 1/2 × base × height.
- Check the unit: m/s × s = m.
You need this method only for sections of uniform speed or uniform acceleration.
Worked example 1
Distance from the area under a speed–time graph
Problem
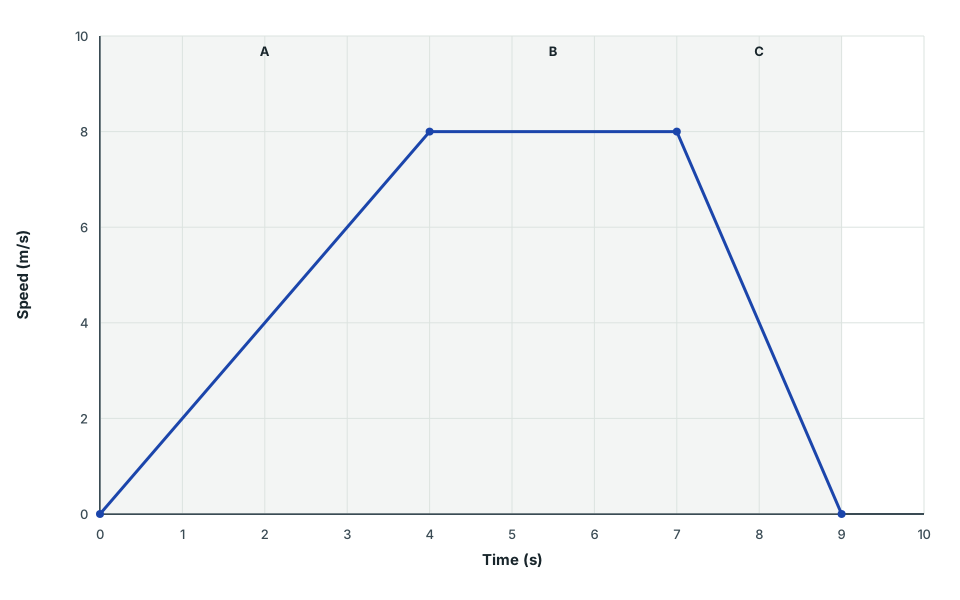
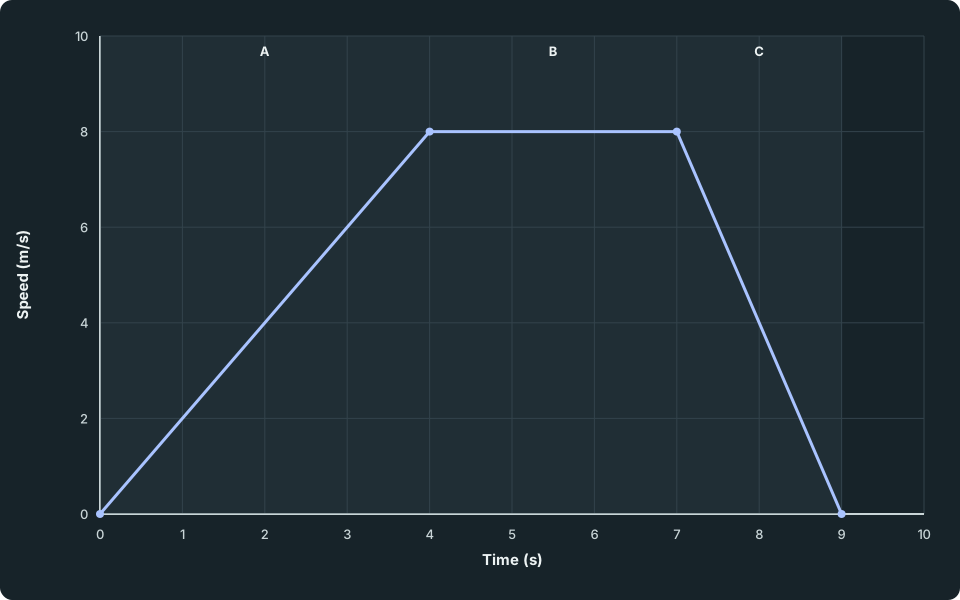
A trolley accelerates uniformly from rest to 8 m/s in 4 s, travels at 8 m/s for 3 s, then slows uniformly to rest in 2 s. Find its acceleration in section A and the total distance travelled.
Speed–time graph of a trolley
Speed in m/s against time in s. The line rises straight from 0 m/s at 0 s to 8 m/s at 4 s, stays level at 8 m/s until 7 s, then falls straight to 0 m/s at 9 s. Bands mark section A from 0 s to 4 s, section B from 4 s to 7 s and section C from 7 s to 9 s.
Scroll across the figure to read all labels.
View figure data
| Time (s) | Trolley |
|---|---|
| 0 | 0 |
| 4 | 8 |
| 7 | 8 |
| 9 | 0 |
Show full solution
Acceleration in section A
Method
Divide the change in speed by the time.Reason
Acceleration is the gradient of the speed–time graph.Working
Answer
(8 - 0) ÷ 4 = 2.0 m/s²
Triangle A
Method
Find the area of the first triangle.Reason
The area under a speed–time graph is the distance travelled.Working
Answer
1/2 × 4 × 8 = 16 m
Rectangle B
Method
Multiply speed by time.Reason
At a steady speed the area is a rectangle.Working
Answer
3 × 8 = 24 m
Triangle C
Method
Find the area of the last triangle.Reason
Uniform slowing gives a straight line down to zero.Working
Answer
1/2 × 2 × 8 = 8 m
Total distance
Method
Add the three areas.Reason
The sections follow one after another.Working
Answer
16 + 24 + 8 = 48 m
Check
Working
Answer
At a steady 8 m/s for all 9 s the trolley would cover 72 m. It spends part of the time slower, so 48 m is sensible.
When the speed does not start from zero, the area is a trapezium. A robot speeding up uniformly from 2.5 m/s to 7.5 m/s in 8.0 s travels 1/2 × (2.5 + 7.5) × 8.0 = 40 m.
Check your understanding 5
A speed rises uniformly from 4.0 m/s to 10 m/s in 3.0 s. Split the area into a rectangle and a triangle to find the distance.
Show the steps Optional working
Show the steps Optional working
Show answer
Rectangle: 4.0 × 3.0 = 12 m. Triangle: 1/2 × 3.0 × (10 - 4.0) = 9.0 m. Distance = 12 + 9.0 = 21 m.
One motion, two graphs
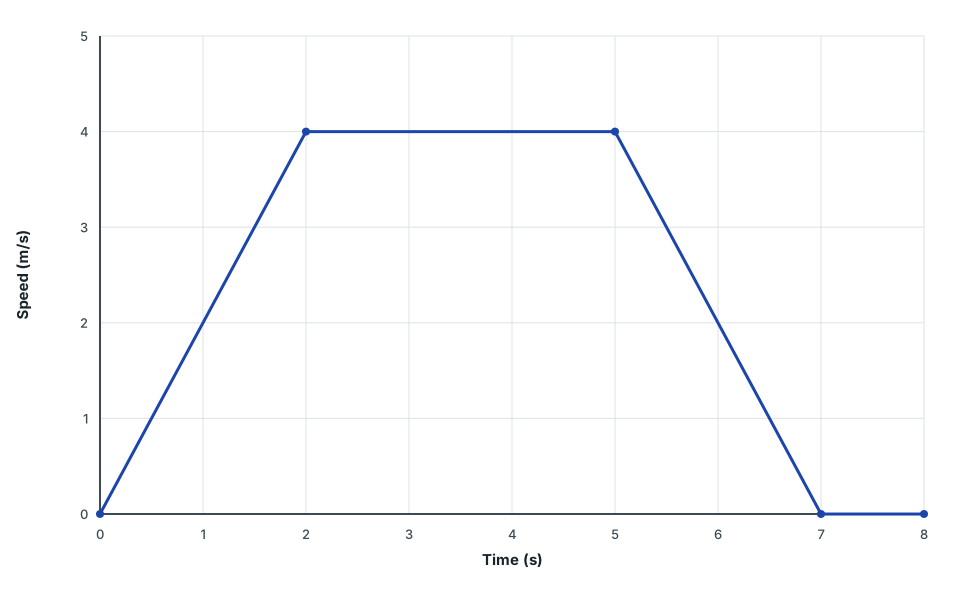
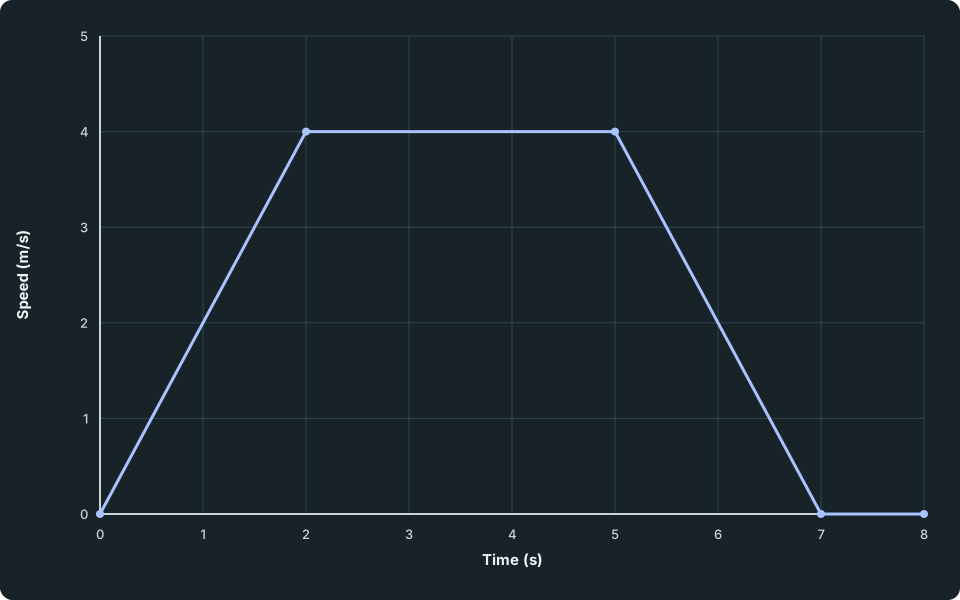
A toy train accelerates uniformly from rest to 4 m/s in 2 s, runs at 4 m/s for 3 s, slows uniformly to rest in 2 s, then waits for 1 s.
Speed–time graph of a toy train
Speed in m/s against time in s from 0 s to 8 s. The line rises straight from 0 m/s at 0 s to 4 m/s at 2 s, stays level at 4 m/s until 5 s, falls straight to 0 m/s at 7 s, then stays on the time axis until 8 s.
Scroll across the figure to read all labels.
View figure data
| Time (s) | Toy train |
|---|---|
| 0 | 0 |
| 2 | 4 |
| 5 | 4 |
| 7 | 0 |
| 8 | 0 |
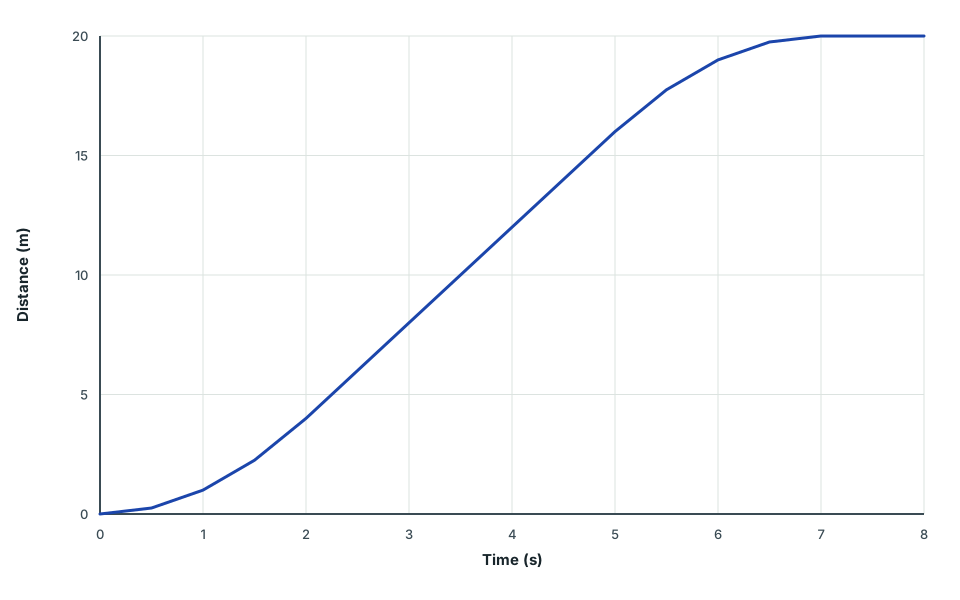
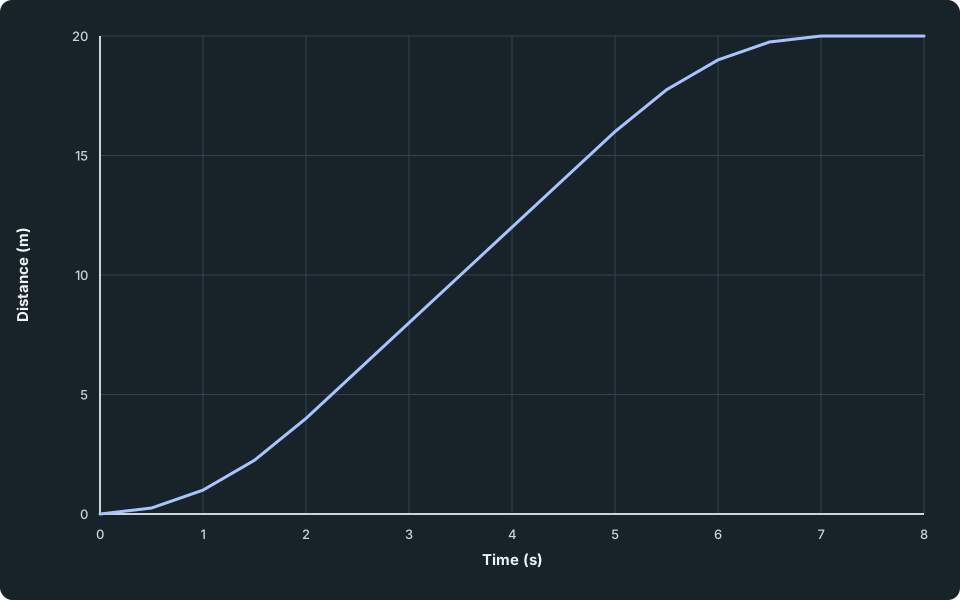
Distance–time graph of the same toy train
Distance in m against time in s from 0 s to 8 s. The curve starts level and gets steeper up to 4 m at 2 s, rises in a straight line to 16 m at 5 s, then gets less steep and levels off at 20 m at 7 s. It stays level at 20 m until 8 s. The data table lists every point.
Scroll across the figure to read all labels.
View figure data
| Time (s) | Toy train |
|---|---|
| 0.0 | 0.00 |
| 0.5 | 0.25 |
| 1.0 | 1.00 |
| 1.5 | 2.25 |
| 2.0 | 4.00 |
| 3.0 | 8.00 |
| 4.0 | 12.00 |
| 5.0 | 16.00 |
| 5.5 | 17.75 |
| 6.0 | 19.00 |
| 6.5 | 19.75 |
| 7.0 | 20.00 |
| 8.0 | 20.00 |
| Time | Speed–time graph | Distance–time graph | Motion |
|---|---|---|---|
| 0–2 s | straight line rising | curve getting steeper | uniform acceleration |
| 2–5 s | horizontal at 4 m/s | straight line, gradient 4 m/s | uniform speed |
| 5–7 s | straight line falling | curve getting less steep | uniform deceleration |
| 7–8 s | along the time axis | horizontal at 20 m | at rest |
The two graphs agree. The distance–time gradient from 2 s to 5 s is (16 - 4) ÷ 3 = 4 m/s, the height of the speed–time graph. The final distance, 20 m, equals the total area under the speed–time graph: 4 + 12 + 4 = 20 m.
Check your understanding 6
A runner’s speed is measured every 2 s: 0, 3, 6, 6 and 6 m/s at 0, 2, 4, 6 and 8 s. Assume uniform acceleration from 0 s to 4 s and steady speed from 4 s to 8 s. Plot the speed–time graph on paper with labelled axes and a consistent scale, then use it to find the acceleration in the first 4 s and the distance travelled in 8 s.
Show the steps Optional working
Show answer
Self-review the plot: time / s is horizontal and speed / m/s vertical, with consistent scales covering 0–8 s and 0–6 m/s. Points (0, 0), (2, 3) and (4, 6) lie on the rising straight section; (4, 6), (6, 6) and (8, 6) lie on the horizontal section. The stated motion justifies these straight lines. Check your paper plot against these points, axes and line shapes. Acceleration = 6 ÷ 4 = 1.5 m/s². Distance = 1/2 × 4 × 6 + 6 × 4 = 12 + 24 = 36 m.
Check your understanding 7 Same shape, different vertical quantities
One panel has a distance–time line horizontal at 18 m from 2 s to 5 s. Another has a speed–time line horizontal at 6 m/s over the same interval. Describe each motion and find the additional distance during that interval. Explain the difference in the next question.
Show the steps Optional working
Show answer
The distance stays at 18 m, so the first object is at rest and adds 0 m. The second object keeps moving at 6 m/s and adds 6 × (5 − 2) = 18 m. A horizontal line means the vertical quantity is unchanged: unchanged distance is rest, while unchanged nonzero speed is steady motion. The 18 m height in the first panel is the earlier distance, not the distance added during these three seconds.
Check your understanding 8 Explain the difference between the two panels
Why does a horizontal distance–time line show rest, while a horizontal speed–time line above zero shows motion?
Show answer
A horizontal line means its vertical quantity stays constant. On the distance–time graph, the distance does not increase, so the object is at rest. On the speed–time graph, the speed stays at 6 m/s, so the object keeps moving and adds distance. Check that your explanation names both quantities rather than using the shape alone.
Challenge yourself
Two runners have the same average speed over 100 m, but one speed–time graph encloses more area in the first half of the race. Explain how both statements can be true and what must happen later.
Check your thinking
Equal total distance means equal total area under each speed–time graph. If one runner has greater area early, the other must gain the same area later. Average speed hides when the distance was covered.
Common mistakes
- Reading the height of a distance–time graph as the speed. The height is the distance travelled; the speed is the gradient, and a high horizontal section means at rest.
- Saying a horizontal speed–time line means the object is at rest. It is moving at that steady speed; it is at rest only when the line lies along the time axis.
- Saying a steeper graph always means a greater acceleration. Only a speed–time gradient is an acceleration; a steeper distance–time line means a greater speed.
- Drawing a distance–time graph that slopes down when the object slows. In one direction the distance never decreases: slowing makes the line less steep, and stopping makes it horizontal.
- Finding the distance as the height of a speed–time graph times the time. That works only for a horizontal line; otherwise use the area of rectangles and triangles.
Spotted an error? Report a correction
Syllabus and review details
- SEC G2 Science Physics component 2027 · 2027
Physics section, PDF pages 8–23
Last reviewed: