Heating and cooling curves
Key idea: During melting or boiling of a pure substance at fixed pressure, energy enters while temperature stays constant. Freezing and condensation release energy at constant temperature.
Offline pages
Saved on this device only. Connect at least once every 30 days to confirm Premium. Sign-out or a change of account removes saved copies.
Loading guide controls…
Guided lessons · coming soon
Guided lesson
Guided steps
- Read the state changes, then follow the heating curve.
- Identify the states and explain what happens to average kinetic energy.
- Follow how particle energy changes in each heating-curve section.
- Follow energy leaving as the substance cools and changes state.
- Use freezing to predict the melting point and energy direction.
- Use the bubbles and temperature to explain the change of state.
- Read why a flat trace can have different causes.
- Find the net energy input each second.
- Use the liquid state and energy account to explain the plateau.
On this page
You stopped at:
ContinueHeat a beaker of crushed ice steadily and record its temperature every minute. The temperature rises, then stops at 0 °C while the ice melts, then rises again, even though the heater never changes. A heating curve shows these flat and sloping sections, and the particle model explains where the energy goes in each one.
A change of state transfers energy without changing the temperature
| Change of state | From → to | Energy is transferred | Temperature during the change |
|---|---|---|---|
| Melting | solid → liquid | to the substance | constant, at its melting point |
| Boiling | liquid → gas | to the substance | constant, at its boiling point |
| Condensation | gas → liquid | from the substance | constant, at its boiling point |
| Solidification (freezing) | liquid → solid | from the substance | constant, at its melting point |
At a fixed pressure, a pure substance melts and solidifies at one temperature and boils and condenses at another. At standard atmospheric pressure, water melts at 0 °C and boils at 100 °C.
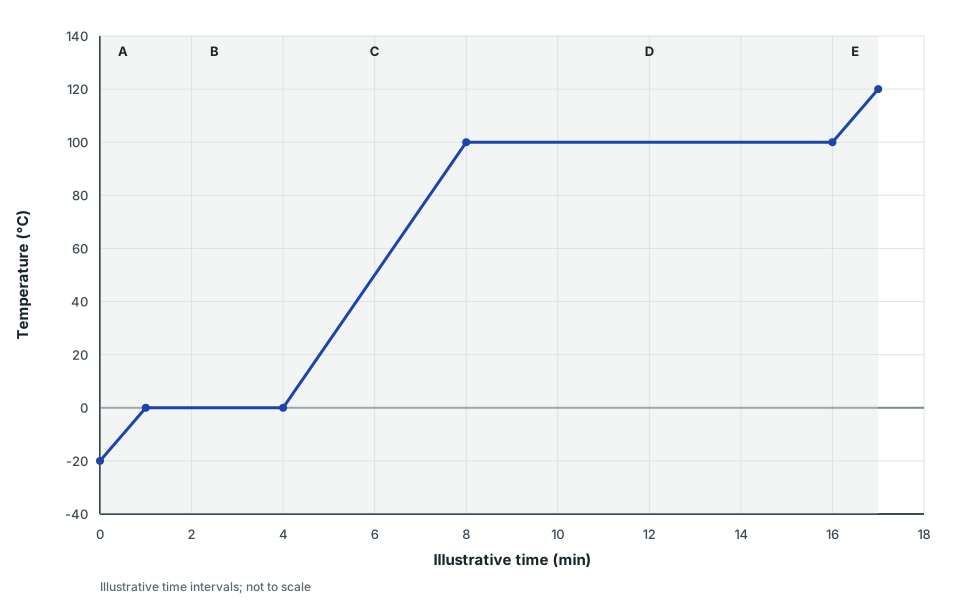
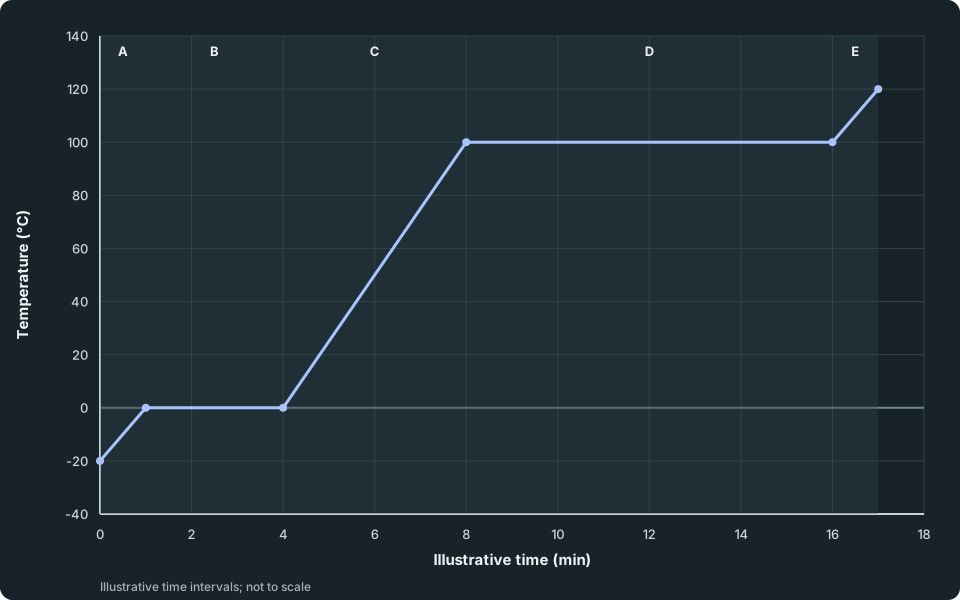
Reading a heating curve. The idealised graph below follows a fixed sample of pure water at constant atmospheric pressure, from ice at −20 °C to water vapour at 120 °C. It assumes a continuing net energy transfer into the sample. The final gas section represents heating the vapour after boiling; a thermometer in an open beaker of boiling liquid does not rise to 120 °C while liquid remains. Read time across and temperature up. A sloping section means the temperature is changing; a flat section means it is constant.
Heating curve of water
Temperature in °C against illustrative time in minutes, divided into five sections. A: the temperature rises from −20 °C at 0 min to 0 °C at 1 min. B: it stays at 0 °C from 1 min to 4 min. C: it rises from 0 °C to 100 °C between 4 min and 8 min. D: it stays at 100 °C from 8 min to 16 min. E: it rises from 100 °C to 120 °C between 16 min and 17 min.
Scroll across the figure to read all labels.
View figure data
| Illustrative time (min) | Temperature |
|---|---|
| 0 | -20 |
| 1 | 0 |
| 4 | 0 |
| 8 | 100 |
| 16 | 100 |
| 17 | 120 |
Check your understanding 1
Energy enters the sample at the same steady rate in every section of the graph. In section B, what is in the beaker, and what happens to the average kinetic energy of the particles?
Show answer
Section B is flat at 0 °C: the ice is melting, so the beaker holds ice and water together. The temperature is constant, so the average kinetic energy of the particles does not change, even though energy still enters the sample.
Worked example 1
Explaining a heating curve
Problem
Explain the state and energy transfer in sections A to E of the heating curve.
Show full solution
Explaining a heating curve
Method
Read the temperature and state in each labelled section.Reason
Steady energy transfer can raise temperature or change particle potential energy during a change of state.Working
Answer
Section Present Temperature What the energy input does A ice rises from −20 °C to 0 °C increases the average kinetic energy of the particles B ice and water constant at 0 °C moves particles out of their fixed positions against their attraction: potential energy increases; average kinetic energy is unchanged C water rises from 0 °C to 100 °C increases the average kinetic energy of the particles D water and steam constant at 100 °C pulls particles far apart against their attraction: potential energy increases; average kinetic energy is unchanged E steam rises from 100 °C to 120 °C increases the average kinetic energy of the particles - Energy enters throughout, so the internal energy of the water increases in every section, including B and D.
- On the sloping sections the energy mainly makes the particles move faster on average, so the temperature rises.
- On the flat sections the energy changes the arrangement and separation of the particles instead. Their potential energy increases while their average kinetic energy stays the same, so the temperature stays constant until the change of state is complete.
- Check: the temperature stays at 0 °C until all the ice has melted, and at 100 °C until all the water has boiled.
The reverse: a cooling curve
When a substance cools, energy is transferred from it and the same ideas run backwards.
Cooling curve for a pure substance
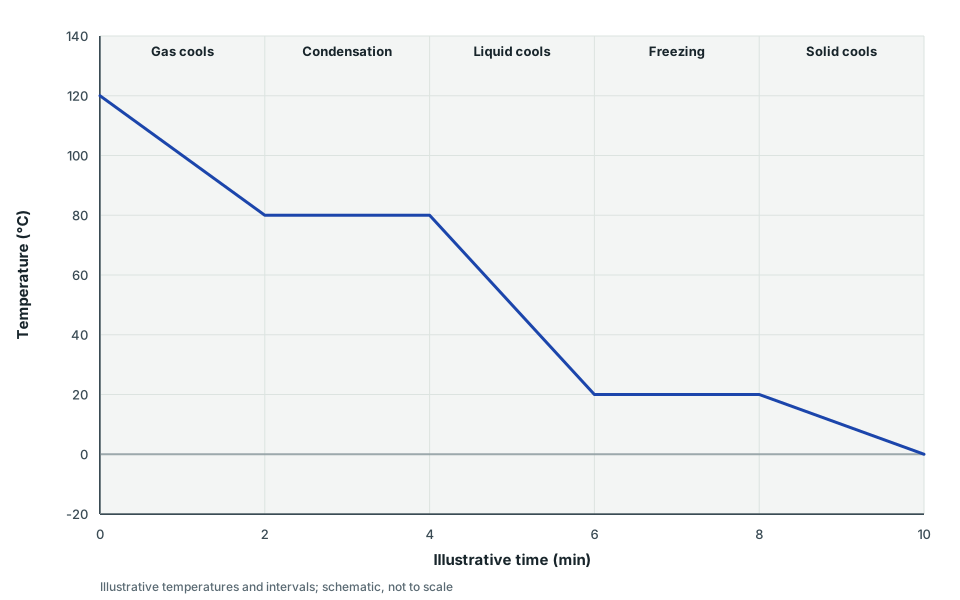
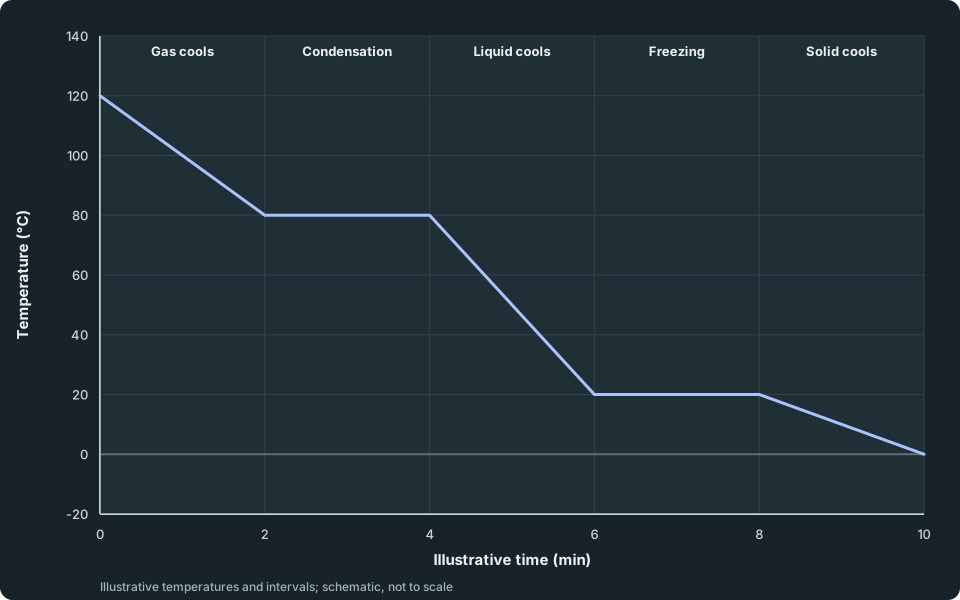
Temperature falls as gas cools to a condensation plateau at 80 °C, then liquid cools to a freezing plateau at 20 °C, then solid cools. The temperatures and times are illustrative, not measured.
Scroll across the figure to read all labels.
View figure data
| Illustrative time (min) | Temperature |
|---|---|
| 0 | 120 |
| 2 | 80 |
| 4 | 80 |
| 6 | 20 |
| 8 | 20 |
| 10 | 0 |
On a downward slope the temperature falls, so the average kinetic energy of the particles decreases. At the flat section at 80 °C, gas and liquid are present together: the substance is condensing. Energy is leaving, the particles come closer together and their potential energy decreases, but their average kinetic energy stays the same, so the temperature stays at 80 °C. The flat section at 20 °C is solidification. The graph shows temperature, not internal energy: a flat line does not mean the internal energy is constant or that the particles have stopped.
Check your understanding 2
Pure liquid stearic acid cools at constant pressure, stays at 69 °C from 3 min to 7 min, then cools further. What states are present during the flat section, and what is the melting point of stearic acid? If the solid were then heated steadily at the same pressure, at what temperature would its heating curve be flat, and would energy be entering or leaving the sample during that section?
Show answer
Liquid and solid are present together: the stearic acid is freezing. A pure substance melts and freezes at the same temperature, so its melting point is 69 °C. On heating, the curve would be flat at 69 °C while the solid melts. Energy enters the sample: the particles’ potential energy increases while their average kinetic energy stays constant.
Check your understanding 3
A pure liquid is heated steadily at atmospheric pressure. Its temperature rises to 78 °C, then stays at 78 °C for 6 minutes while bubbles form throughout the liquid; some liquid is still left at the end. Name the change of state, say what is present during the flat section, and explain why the temperature does not rise although the heater stays on.
Show answer
The liquid is boiling, so liquid and gas are present together. The energy entering the sample pulls particles far apart against their attraction: their potential energy increases while their average kinetic energy stays the same, so the temperature stays at 78 °C. It will stay there until all the liquid has boiled.
What causes a flat temperature trace?
The thermometer measures temperature, not the net energy entering a sample or its state. To interpret a flat section, also check whether the sample is changing state and whether energy entering it is balanced by energy leaving it. The idealised phase-change graph supplies those conditions; a real experiment needs evidence for them.
Check your understanding 4 Find the net transfer
A beaker of liquid warms from 20 °C to 40 °C, then remains at 40 °C. It stays liquid, with no freezing or boiling. During the flat section, 6 J enters the liquid each second and 6 J leaves it each second. Find the net energy input each second.
Show answer
Net input each second = 6 − 6 = 0 J/s. The liquid gains no energy overall during the flat section.
Check your understanding 5 Test a plateau explanation against the observations
For the beaker above, a learner says that every flat section means energy entering the sample is increasing particle potential energy during a change of state. Use the observations and energy account to correct this explanation.
Show answer
The two transfers balance: 6 − 6 = 0 J net input each second. With no state change and no net energy accumulation, the liquid’s internal energy stays constant, and the constant temperature means its average particle kinetic energy is unchanged. This plateau is not melting or boiling: the observations explicitly rule out those state changes. On the idealised melting or boiling plateau, net energy enters the sample and increases particle potential energy. Check the state and the net energy transfer as well as the temperature trace.
Common mistakes
- Saying the heater is off, or the particles have stopped, during the flat melting or boiling section of the idealised curve. Net energy enters and increases particle potential energy while average kinetic energy stays constant.
- Assuming every flat section has the same energy change. Internal energy increases during melting or boiling and decreases during freezing or condensation. With no state change and balanced transfers, it stays constant.
- Saying condensation happens at a different temperature from boiling. For a pure substance at fixed pressure, both happen at the boiling point.
- Reading every flat section as melting. It could be another state change or balanced energy transfers; check the states and net energy input.
Spotted an error? Report a correction
Syllabus and review details
- SEC G2 Science Physics component 2027 · 2027
Physics section, PDF pages 8–23
Last reviewed: