Thermal transfer investigation
Key idea: Compare insulation by recording water temperature as it cools. Change one design feature, keep water amount and starting temperature the same, and compare the cooling curves.
Offline pages
Saved on this device only. Connect at least once every 30 days to confirm Premium. Sign-out or a change of account removes saved copies.
Loading guide controls…
Guided lessons · coming soon
Guided lesson
Guided steps
- Choose one factor and keep the other conditions alike.
- Follow the plan for a fair cooling comparison.
- Choose the fair lid comparison and its reason.
- Compare the curves over the same time interval.
- Find the average temperature fall per minute.
- Compare cooling times through the same temperature range.
- Find ways to improve the comparison.
- Choose what to keep the same in the surface test.
- Find the warming rates and the direction of energy transfer.
- Explain how insulation keeps hot drinks hot and cold drinks cold.
On this page
You stopped at:
ContinueWhich keeps a drink hot longer, a polystyrene cup or a thin plastic one? You can find out by pouring hot water into each and watching how fast it cools. Energy leaves the water by conduction, convection, radiation and evaporation, and many things affect how fast, so a fair test changes one factor, keeps the others the same, and compares the cooling curves. Hot water can scald even below boiling point: use the temperature and apparatus your teacher chooses, on a stable tray.
Choose one factor to investigate
The rate at which hot water loses energy depends on:
- the temperature difference between the water and the room: for the same set-up, a larger difference generally produces faster cooling;
- the material of the container: expanded polystyrene contains trapped gas and reduces conduction through the wall;
- the surface: a matt black coating generally emits infrared more effectively than a bare, polished metal surface at the same temperature;
- whether there is a lid: a close-fitting lid limits air exchange and evaporation above the water;
- the surface area, wall thickness and shape of the container.
Choose one factor and keep other relevant conditions as similar as possible. If two cups differ in material, thickness and shape, the result compares cup designs; it does not isolate the effect of material alone. The temperature difference changes during every run. To compare temperature falls over a fixed time, all the cups must start at the same temperature.
To compare insulating materials, you can also wrap identical containers in equal thicknesses of each material, covering the same area and fitting closely. An unwrapped container, set up in the same way, shows how much each material slows the cooling.
Worked example 1
A plan for comparing two cups
Problem
Plan an investigation to find whether a polystyrene cup keeps water hot better than a thin plastic cup.
Show full solution
Variables
Method
Independent: which cup design is used. Dependent: the temperature fall over the same elapsed time.
Reason
With the same mass of water, temperature fall compares cooling performance. Different cup heat capacities and walls prevent you from treating this as a measurement of the materials’ thermal conductivity.
Working
Answer
Use the same water mass (approximately the same volume at the same starting temperature), similar cup capacities and exposed areas, identical lids, the same room conditions and thermometer immersion. Record unavoidable differences in shape and wall thickness. Read each cup at one-minute elapsed intervals.
Method
Method
Measure equal amounts of water using heat-safe apparatus chosen by your teacher. Fit identical lids and support the thermometer bulbs in the water, clear of the walls and bottom.
Reason
For water at the same temperature, equal volumes give approximately equal masses. Stir gently so the thermometer represents the bulk water temperature.
Working
Answer
Choose a common starting temperature within your teacher’s approved method. Record each cup’s own start time when it reaches that temperature. Read at elapsed times of 0, 1, 2, …, 10 minutes for that cup; stagger the starts or use two observers so each reading is on time.
Analyse and repeat
Method
Plot both cooling curves on one grid and compare the temperature falls over 10 minutes.
Reason
One grid makes the comparison direct.Working
Answer
Repeat the whole comparison to check that the difference is larger than the scatter between runs.
State the comparison
Working
Answer
Compare the temperature falls in 10 minutes from equal starting temperatures and water masses. The cup with the smaller fall keeps its water hotter in this test; repeat before deciding whether the difference is reliable.
Quick check
The plan compares the tested cup designs. To investigate an insulating material more closely, wrap identical containers and control the wrap thickness and covered area.
Check your understanding 1 Testing a lid
Three identical cups each hold 150 cm³ of water. A has a lid and starts at 80 °C; B has no lid and starts at 70 °C; C has no lid and starts at 80 °C. Choose the fairest comparison and the reason.
Show answer
A and C share water volume and starting temperature, so the lid is the changed factor. A and B also differ in starting temperature, which changes cooling even without a lid effect.
These constructed example readings use 150 cm³ of water in each cup, starting at 80.0 °C, in a room at 27 °C. Use them to practise analysing cooling; they are not measurements from an experiment.
| t / min | plastic cup θ / °C | polystyrene cup θ / °C |
|---|---|---|
| 0 | 80.0 | 80.0 |
| 1 | 77.5 | 79.0 |
| 2 | 75.0 | 78.0 |
| 3 | 73.0 | 77.0 |
| 4 | 71.0 | 75.5 |
| 5 | 69.0 | 74.5 |
| 6 | 67.0 | 74.0 |
| 7 | 65.0 | 73.0 |
| 8 | 63.5 | 72.0 |
| 9 | 61.5 | 71.0 |
| 10 | 60.0 | 70.0 |
For this example, a thermometer with 1 °C divisions is read by interpolation and readings are recorded to the nearest 0.5 °C. Check the thermometer specification when assessing measurement uncertainty.
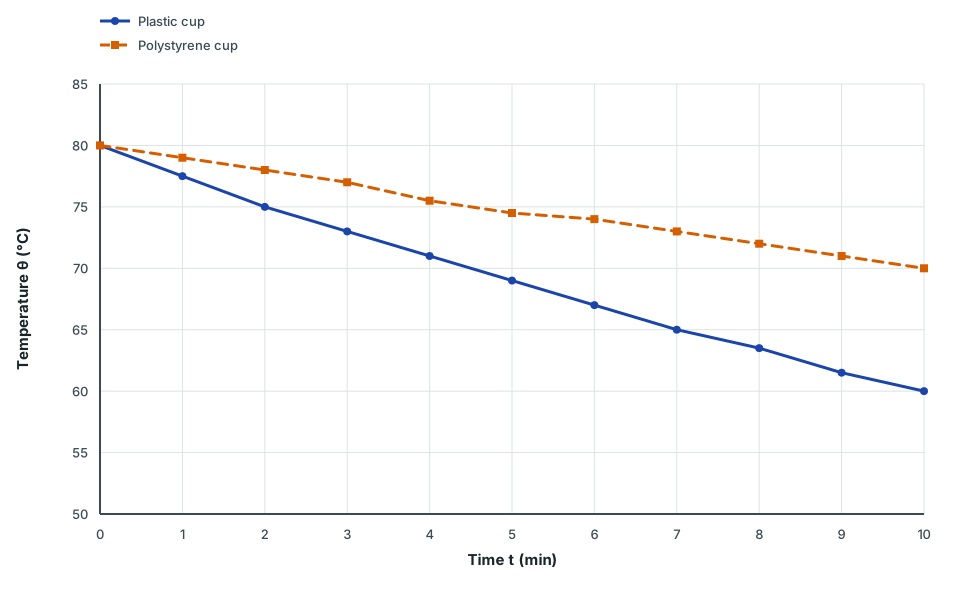
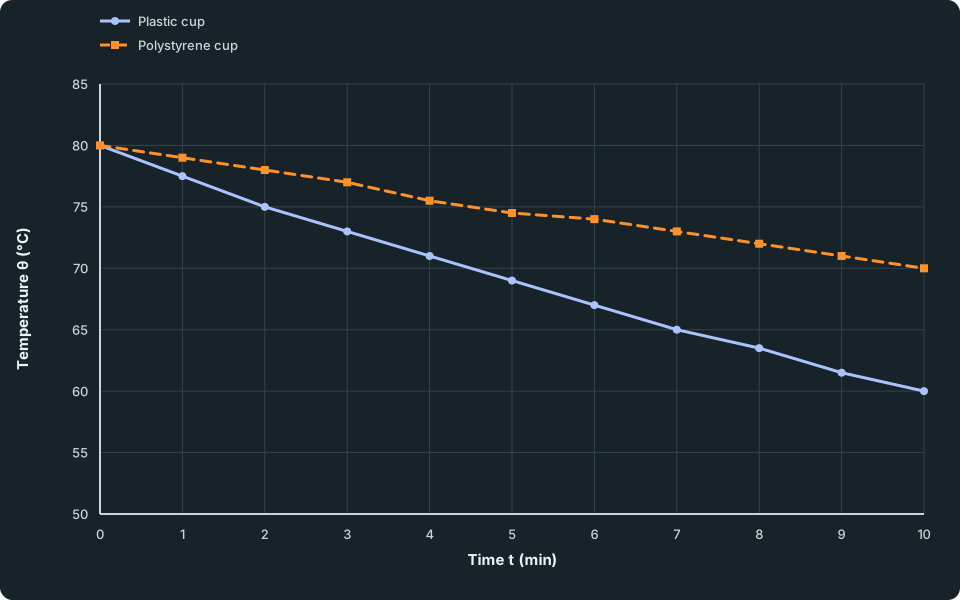
Cooling curves for two cups
Two cooling curves of water temperature in °C against time in minutes from 0 to 10 minutes. Both start at 80.0 °C. The plastic-cup curve, drawn solid with circles, falls more steeply than the polystyrene-cup curve, drawn dashed with squares. The data table lists every reading.
Scroll across the figure to read all labels.
View figure data
| Time t (min) | Plastic cup | Polystyrene cup |
|---|---|---|
| 0 | 80.0 | 80.0 |
| 1 | 77.5 | 79.0 |
| 2 | 75.0 | 78.0 |
| 3 | 73.0 | 77.0 |
| 4 | 71.0 | 75.5 |
| 5 | 69.0 | 74.5 |
| 6 | 67.0 | 74.0 |
| 7 | 65.0 | 73.0 |
| 8 | 63.5 | 72.0 |
| 9 | 61.5 | 71.0 |
| 10 | 60.0 | 70.0 |
On paper, draw a smooth best-fit curve following each trend rather than forcing it through every point. The displayed segments connect the example readings. Cooling generally slows as water approaches room temperature; individual rounded readings can scatter around that trend.
Worked example 2
Comparing the cooling curves
Problem
Use the readings to compare the two cups and write a conclusion.
Show full solution
Temperature fall in 10 minutes
Method
Subtract the final reading from the starting reading for each cup.
Reason
Both started at 80.0 °C and were read over the same time, so the falls can be compared directly.
Working
Answer
Plastic: 80.0 − 60.0 = 20.0 °C. Polystyrene: 80.0 − 70.0 = 10.0 °C.
Average rate of cooling
Method
Divide each fall by the time.Reason
A rate makes the comparison clear in one number per cup.
Working
Answer
Plastic: 20.0 ÷ 10 = 2.0 °C/min. Polystyrene: 10.0 ÷ 10 = 1.0 °C/min.
Interpret the difference
Method
Over these 10 minutes, the water in the polystyrene cup had half the average rate of temperature decrease.
Reason
Expanded polystyrene can reduce conduction through the wall. However, these cups also differ in design, and temperature changes alone do not separate conduction, convection, evaporation and radiation.
Working
Answer
“Under these conditions, the tested polystyrene cup kept its water hot for longer: its water fell by 10.0 °C in 10 minutes compared with 20.0 °C for the plastic cup.”
State the conclusion
Working
Answer
Under these conditions, the polystyrene cup kept its water hotter: it cooled by 10.0 °C rather than 20.0 °C in 10 minutes. Its average cooling rate was 1.0 °C/min, compared with 2.0 °C/min for the plastic cup.
Quick check
The conclusion quotes evidence and stays within what was tested: two cups, with lids, over 10 minutes.
Check your understanding 2 Find a rate over the stated interval
Show the steps Optional working
Show answer
The temperature fall is 75.0 − 63.0 = 12.0 °C, so the average rate of cooling is 12.0/8.0 = 1.5 °C/min. The instantaneous cooling rate can change during the interval.
Guided practice 3
A comparison that is not fair
Problem
Cup C starts at 90 °C and reaches 70 °C at 12 minutes and 60 °C at 20 minutes. Cup D starts at 70 °C and reaches 60 °C at 10 minutes. The water masses and room conditions are equal. Which intervals should you compare, and which cup keeps the water hot longer over that range?
Explain, then improve
Hints
Hint 1
what else changed?
Find a temperature range that both cups pass through.
Hint 2
same temperature range
Subtract the two elapsed times for cup C. Cup D begins at the top of the shared range.
Show solution step by step
Choose matching temperatures
Method
Compare cooling from 70 °C to 60 °C.Reason
Both cups pass through this range, so they can be compared at matching temperature differences from the room. Their full runs begin at different temperatures and do not give that comparison.
Working
Answer
For C, use the interval from 12 to 20 minutes. For D, use the interval from 0 to 10 minutes.
Compare the cooling times
Method
C takes 8 minutes; D takes 10 minutes.Reason
Taking longer to cool through the same range means the water stays hotter longer under these conditions.
Working
Answer
C: 20 - 12 = 8 minutes. D: 10 - 0 = 10 minutes. D takes 2 minutes longer.
State the comparison
Working
Answer
Cup D keeps the water hot longer over 70 °C to 60 °C in this test. Compare matching temperature ranges with equal water masses and room conditions, and repeat the test before deciding whether the difference is reliable.
Quick check
Compare the time within the shared temperature range, rather than the elapsed time from each cup’s different starting temperature.
Evaluate the method
| Source | Effect | Improvement |
|---|---|---|
| Water cools while it is poured and the lids fitted | The cups do not start at the same temperature | Record each cup’s start time at the agreed common starting temperature. |
| Thermometer bulb touching the side of the cup | It can be influenced by the wall, rather than represent the bulk water temperature | Hold the thermometer through the lid so that the bulb is in the middle of the water. |
| Water hotter at the top than the bottom | Readings depend on where the bulb is | Stir gently before each reading. |
| One person reading two cups at the same moment | Readings are late or rushed | Stagger start times and use each cup’s elapsed-time schedule, or use two observers. |
| A draught from a fan or window on one cup | That cup cools faster for a reason other than its design | Place both cups side by side, away from fans and windows. |
| A small difference between the cups | It may be smaller than the scatter between runs | Repeat the comparison and check that the difference appears each time. |
Test another factor. Use the same method to investigate the surface: compare identical metal cans with different outside surface treatments: one matt black and one bare, polished metal. Keep water mass, lids, exposed area and starting temperature the same. Compare the effect of the surface treatment on total cooling. Conduction, convection and evaporation also occur. A matt black coating usually emits infrared more strongly than polished metal; visible colour alone is an unreliable guide.
Check your understanding 3 Identify the controlled variable
Show answer
Keep the water volume the same at the common starting temperature, giving approximately equal water masses. Surface treatment is the changed independent variable; temperature after ten minutes is measured. Also match lids, geometry, room conditions and the reading method. A cooling comparison does not separate radiation from all other transfers.
Check your understanding 4 Insulation with cold water
Each container starts with the same mass of water at 5.0 °C in a 27 °C room. After 10 min, A reaches 13.0 °C and B reaches 9.0 °C. Find the average warming rates. Which keeps water colder, and which way is energy transferred?
Show the steps Optional working
Show the steps Optional working
Show answer
A warms at (13.0 − 5.0)/10 = 0.80 °C/min; B warms at (9.0 − 5.0)/10 = 0.40 °C/min. B keeps water colder. Both samples gain energy from the warmer room; insulation slows that transfer.
Check your understanding 5 Explain insulation in both directions
Explain why insulation can keep hot water hot and cold water cold. Use the direction of energy transfer in each case.
Show answer
Energy leaves hot water for cooler surroundings, but enters cold water from warmer surroundings. Insulation slows energy transfer in either direction, so it reduces both cooling of hot water and warming of cold water.
Common mistakes
- Comparing temperature falls from different starting temperatures.
- Changing more than one thing at once, such as the cup material and its shape, and crediting the result to one of them.
- Saying “cold” enters the cup. Energy leaves the hotter water for the cooler surroundings.
- Claiming one material always insulates better from a test of two particular cups.
- Letting the thermometer bulb touch the side of the cup, or reading without stirring.
Spotted an error? Report a correction
Syllabus and review details
- SEC G2 Science Physics component 2027 · 2027
Physics section, PDF pages 8–23
Last reviewed: