I/V Graph Of Thermistor
Key idea: Learn how a thermistor’s resistance changes with temperature (NTC/PTC), what its I–V curve shows, and how to find R = V/I at a point (O Level).
Continue where you stopped
The core idea
On this page
Learning objectives
- State current as rate of charge flow measured in amperes
- Distinguish conventional current from electron flow
- Apply charge equals current multiplied by time
- Define source e.m.f. as work done per unit charge around a circuit
- Calculate total e.m.f. for sources in series
- Define component potential difference as work done per unit charge
- State resistance as potential difference divided by current
- Apply resistance equals potential difference divided by current
- Apply wire-resistance proportionalities for length and cross-sectional area
- Describe the effect of temperature on metallic resistance
- Sketch and interpret required current–voltage characteristics
1. Definition
Thermistors are examinable in D.C. Circuits as input transducers in potential dividers, but the I–V graph of a thermistor is not required in the 6091 O Level syllabus.
If you’re revising for exams, focus on: LDR & Thermistor in Potential Dividers.
A thermistor is a resistor whose resistance changes with temperature.
- NTC thermistor: resistance decreases when temperature increases.
- PTC thermistor: resistance increases when temperature increases.
2. Key Ideas
- When current increases, the thermistor warms up.
- For an NTC thermistor, warming up makes resistance decrease, so current increases faster at higher voltages.
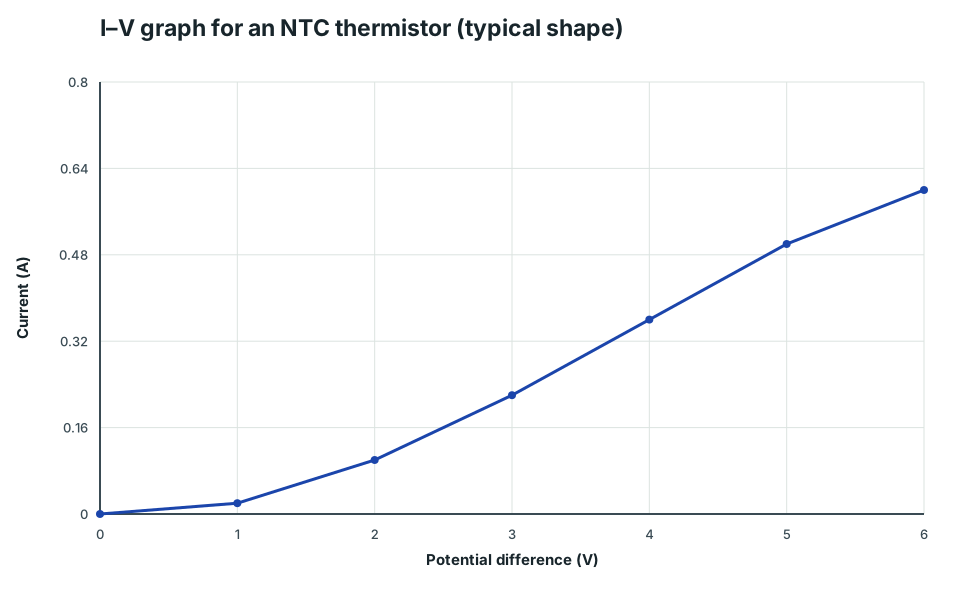
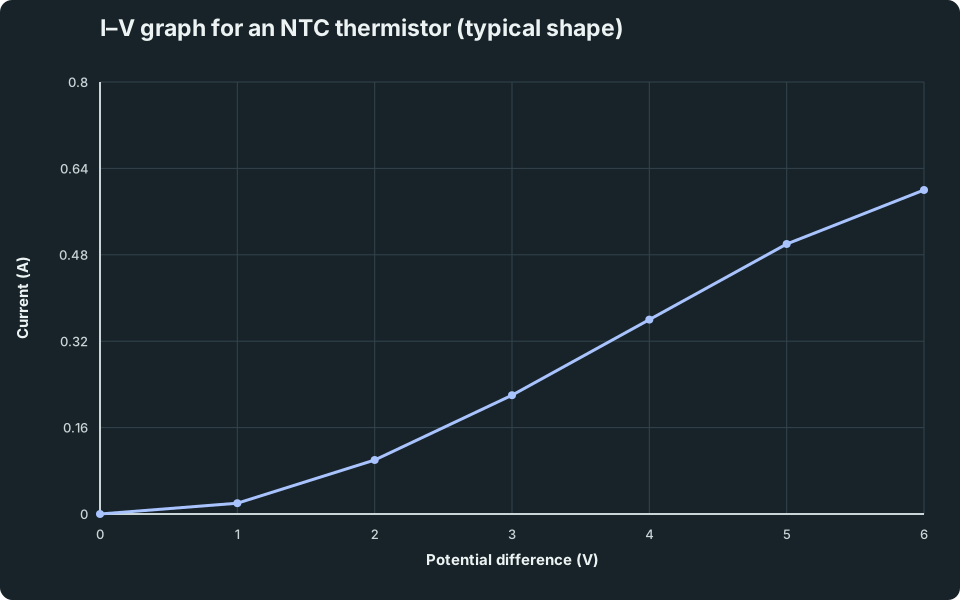
- On an I vs V graph, this often looks like a curve that becomes steeper as V increases (for an NTC thermistor).
- Resistance at a point: R = V/I (use that point’s values). Resistance is not the gradient.
3. Detailed Explanations
A. Why an NTC thermistor gives a curve
- Increase the p.d. across the thermistor.
- Current increases, so the thermistor warms up.
- For an NTC thermistor, higher temperature means lower resistance.
- Lower resistance makes the current increase even more, so I does not increase proportionally with V.
B. Comparing common I–V shapes (I vs V)
| Component | Typical I–V shape | Key reason |
|---|---|---|
| Metallic conductor (constant temperature) | straight line through origin | resistance constant |
| Filament lamp | curve that becomes shallower | heating increases resistance |
| NTC thermistor | curve that becomes steeper | heating decreases resistance |
I–V graph for an NTC thermistor (typical shape)
A thermistor I–V curve that becomes steeper at higher voltages because heating reduces resistance for an NTC thermistor.
Scroll across the graph to read all labels.
View figure data
| Potential difference (V) | NTC thermistor |
|---|---|
| 0 | 0 |
| 1 | 0.02 |
| 2 | 0.1 |
| 3 | 0.22 |
| 4 | 0.36 |
| 5 | 0.5 |
| 6 | 0.6 |
4. Common Mistakes
- Saying “the gradient is the resistance” (use R = V/I at a point).
- Mixing up NTC and PTC (NTC: temperature increases → resistance decreases).
- Confusing an NTC thermistor curve with a filament lamp curve (lamp resistance increases when it heats).
5. Exam Tips
- In 6091, you usually do not need the thermistor I–V graph. If it appears, describe the curve and link it to temperature change.
- For an NTC thermistor, use: “current increases → thermistor heats → resistance decreases → graph becomes steeper”.
- If asked for resistance at a point, calculate R = V/I at that point.
6. Worked Examples
Modelled example 1
Resistance at a point
Problem
At one point on an I–V curve, V = 3.0 V and I = 0.20 A. Find the resistance at that operating point.
Study the worked solution
Use the coordinates of the operating point
Method
Calculate the ratio V/I using the two coordinates.Reason
Resistance at an operating point is defined by the potential difference across the component divided by its current.Working
R = V/I = 3.0/0.20 = 15 Ω
Guided practice 2
Comparing resistance at two points
Problem
At A, (V,I) = (2.0 V,0.10 A). At B, (V,I) = (6.0 V,0.60 A). Calculate the resistance at each point and use the values to describe the change.
Complete the guided steps
Hints
Hint 1: treat each point separately
Hint 2: compare the results
View solution step by step
Calculate each point resistance
Reason
A non-linear component does not have one constant resistance for its whole curve.Working
R_A = 2.0/0.10 = 20 Ω, R_B = 6.0/0.60 = 10 ΩInterpret the change
Working
The resistance decreases from 20 Ω to 10 Ω, consistent with an NTC thermistor heating up.
Common misconception 3
Resistance is not the gradient
Learner response
At a point on a curved I–V graph, V = 5.0 V and I = 0.50 A. A learner draws a tangent and calls its gradient the resistance. Locate the first conceptual error, then find the resistance.
Diagnose before viewing the correction
View solution step by step
Diagnose the graph-ratio error
Method
Reject the tangent gradient as the required resistance.Reason
On an I-against-V graph the tangent gradient is Δ I/Δ V, while point resistance uses the coordinate ratio V/I.Working
Read the voltage and current coordinates at the operating point and calculate R = V/I. On an I-against-V graph, even the origin-to-point slope is I/V, so its reciprocal gives resistance.Calculate the point resistance
Reason
The coordinate pair describes the component’s actual operating condition.Working
R = 5.0/0.50 = 10 Ω
Examiner practice 4
Checking if it is ohmic
Examination question
For a component, V increases from 2.0 V to 4.0 V while I increases from 0.10 A to 0.30 A. Determine whether the component is ohmic and explain using the data. [3 marks]
Write your answer before viewing the mark scheme
View solution step by step
Compare the multiplication factors
1 markMethod
Compare the voltage and current multiplication factors.Reason
An ohmic conductor at constant temperature has I ∝ V and therefore constant V/I.Working
The potential difference doubles, while the measured current increases by a factor of three.State the ohmic prediction
1 markReason
If current were proportional to potential difference, doubling V would double I.Working
The predicted current would be 0.20 A, not 0.30 A.Conclude from the interval
1 markWorking
These readings are not consistent with ohmic behaviour over this interval because I is not proportional to V, and V/I changes.
Self-mark with the mark scheme
Compare your response with each mark point. Select a point only when your response contains that evidence.
Challenge 5
Identifying the curve shape
New context
A temperature sensor has the readings below after each voltage has been applied long enough for its temperature to settle.
| V/V | I/A |
|---|---|
| 1.0 | 0.020 |
| 3.0 | 0.220 |
| 5.0 | 0.500 |
Decide whether its I–V graph becomes steeper or shallower and identify whether its behaviour is consistent with an NTC thermistor or a filament lamp.
Try this without the worked method
Hints
Hint 1: convert the table into resistance evidence
Hint 2: connect resistance to curve shape
View solution step by step
Extract the resistance trend from the table
Reason
The table is a different representation of the same I–V relationship.Working
R_(1.0 V) = 1.0/0.020 = 50 Ω, R_(5.0 V) = 5.0/0.500 = 10 ΩIdentify the curve and component model
Working
The I–V graph becomes steeper and is consistent with an NTC thermistor, not a filament lamp.
7. Mind Stretchers
Mind stretcher 1: Reducing heatingExtension
If you take I–V readings using small currents (so the thermistor hardly heats up), how would the graph change? Explain.
Show Answer
With little heating, the resistance changes less during the measurements. The I–V curve would be closer to a straight line (more “constant resistance” during the test).
Mind stretcher 2: Thermistor vs filament lampExtension
Both a filament lamp and an NTC thermistor heat up when current flows. Why do their I–V graphs curve in opposite ways?
Show Answer
For a filament lamp (metal), heating increases resistance, so the graph becomes shallower. For an NTC thermistor, heating decreases resistance, so the graph becomes steeper.
8. Practice and next step
Treat this page as supporting transfer, not a fourth required Topic 14 graph. Return to the three required I–V characteristics, then continue to thermistors in potential dividers, where the component is examinable.
Continue with the next resource in this course.
Course and syllabus information
- Course
- SEC G3 Physics
- Edition
- SEC G3 Physics 2027