Loudness and pitch
Key idea: A larger amplitude makes the same note louder at the same listening position. A higher frequency raises pitch; changing loudness does not have to change pitch.
Offline pages
Saved on this device only. Connect at least once every 30 days to confirm Premium. Sign-out or a change of account removes saved copies.
Loading guide controls…
Guided lessons · coming soon
Guided lesson
Guided steps
- Compare amplitude and frequency separately when describing sound.
- Use the shared scales to find frequency and compare amplitudes.
- Find C’s frequency and compare the pitch.
- Explain how microphone gain changes trace height.
- Use each microphone gain to find its pressure amplitude.
- Use each time window to compare frequency, pitch and loudness.
On this page
You stopped at:
ContinueA violin can play the same note softly or loudly, or play a higher note at the same loudness. Loudness and pitch are two separate properties of a sound, and each depends on a different feature of the wave: loudness on its amplitude, and pitch on its frequency. A graph of how the air pressure changes with time shows both.
Loudness and pitch
Compare two sounds heard at the same place:
- At the same frequency and listening position, a larger amplitude gives a louder sound. Hitting a drum harder makes the skin vibrate with a larger amplitude, so the pressure changes in the air are bigger and carry more energy to your ear.
- A higher frequency gives a higher pitch. Shortening the vibrating length of a guitar string, or tightening it, makes it vibrate more times each second and gives a higher note.
The two are independent: a note can be made louder without changing its pitch, and higher without changing its amplitude. Your ear is not equally sensitive at every frequency, so two notes with the same amplitude but different frequencies need not sound equally loud.
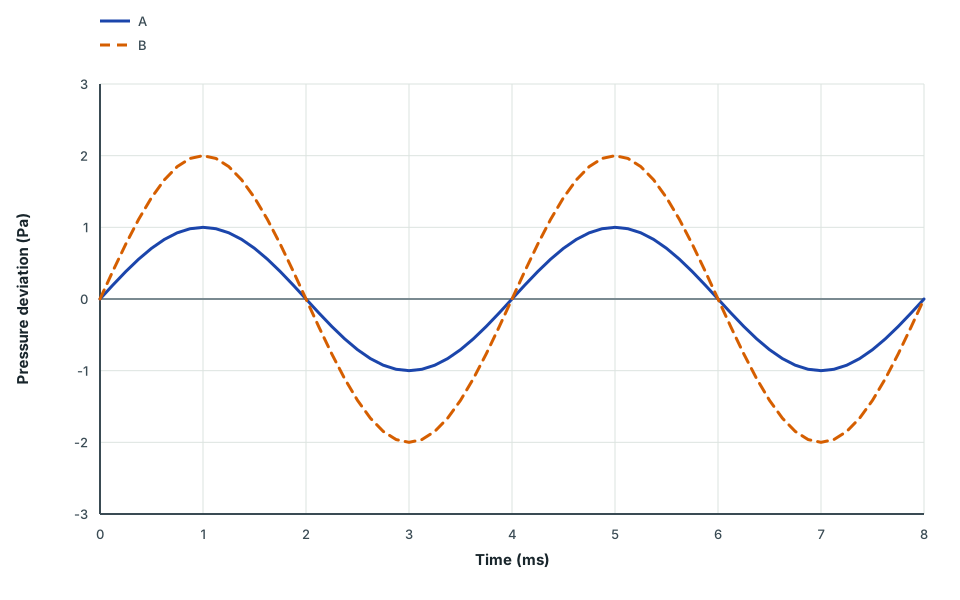
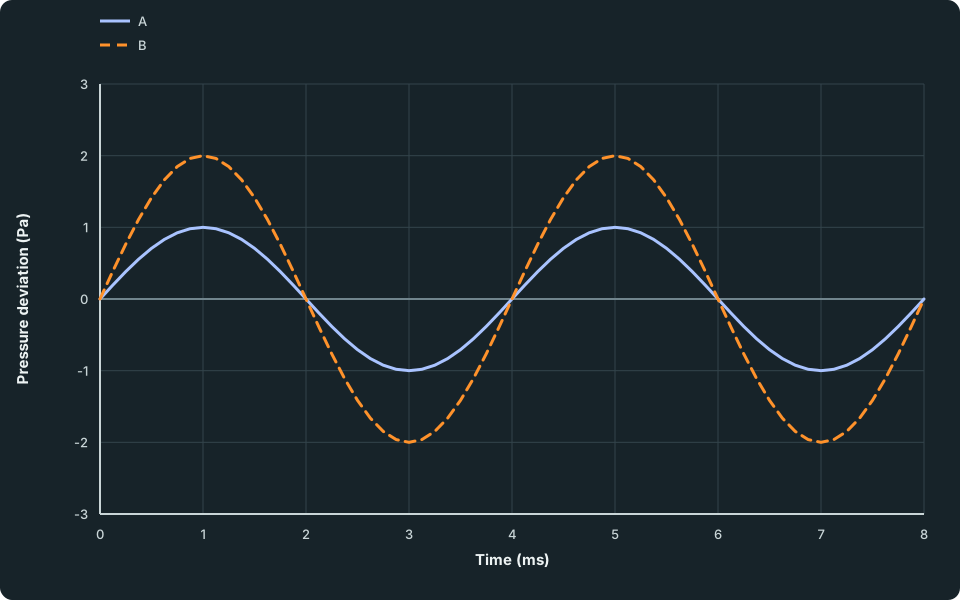
A microphone at one place can show how the air pressure there changes with time. The graphs below are constructed pressure–time traces for one listening position, drawn to the same scales.
Sound records A and B
Pressure change in Pa against time in ms, from 0 ms to 8 ms, for two constructed sound models at a common listening position. Record A varies between +1 Pa and −1 Pa; record B varies between +2 Pa and −2 Pa. Both have maxima at 1 ms and 5 ms, so each completes two cycles in 8 ms.
Scroll across the figure to read all labels.
View figure data
| Time (ms) | A | B |
|---|---|---|
| 0.000 | 0.000000 | 0.000000 |
| 0.125 | 0.195090 | 0.390181 |
| 0.250 | 0.382683 | 0.765367 |
| 0.375 | 0.555570 | 1.111140 |
| 0.500 | 0.707107 | 1.414214 |
| 0.625 | 0.831470 | 1.662939 |
| 0.750 | 0.923880 | 1.847759 |
| 0.875 | 0.980785 | 1.961571 |
| 1.000 | 1.000000 | 2.000000 |
| 1.125 | 0.980785 | 1.961571 |
| 1.250 | 0.923880 | 1.847759 |
| 1.375 | 0.831470 | 1.662939 |
| 1.500 | 0.707107 | 1.414214 |
| 1.625 | 0.555570 | 1.111140 |
| 1.750 | 0.382683 | 0.765367 |
| 1.875 | 0.195090 | 0.390181 |
| 2.000 | 0.000000 | 0.000000 |
| 2.125 | -0.195090 | -0.390181 |
| 2.250 | -0.382683 | -0.765367 |
| 2.375 | -0.555570 | -1.111140 |
| 2.500 | -0.707107 | -1.414214 |
| 2.625 | -0.831470 | -1.662939 |
| 2.750 | -0.923880 | -1.847759 |
| 2.875 | -0.980785 | -1.961571 |
| 3.000 | -1.000000 | -2.000000 |
| 3.125 | -0.980785 | -1.961571 |
| 3.250 | -0.923880 | -1.847759 |
| 3.375 | -0.831470 | -1.662939 |
| 3.500 | -0.707107 | -1.414214 |
| 3.625 | -0.555570 | -1.111140 |
| 3.750 | -0.382683 | -0.765367 |
| 3.875 | -0.195090 | -0.390181 |
| 4.000 | 0.000000 | 0.000000 |
| 4.125 | 0.195090 | 0.390181 |
| 4.250 | 0.382683 | 0.765367 |
| 4.375 | 0.555570 | 1.111140 |
| 4.500 | 0.707107 | 1.414214 |
| 4.625 | 0.831470 | 1.662939 |
| 4.750 | 0.923880 | 1.847759 |
| 4.875 | 0.980785 | 1.961571 |
| 5.000 | 1.000000 | 2.000000 |
| 5.125 | 0.980785 | 1.961571 |
| 5.250 | 0.923880 | 1.847759 |
| 5.375 | 0.831470 | 1.662939 |
| 5.500 | 0.707107 | 1.414214 |
| 5.625 | 0.555570 | 1.111140 |
| 5.750 | 0.382683 | 0.765367 |
| 5.875 | 0.195090 | 0.390181 |
| 6.000 | 0.000000 | 0.000000 |
| 6.125 | -0.195090 | -0.390181 |
| 6.250 | -0.382683 | -0.765367 |
| 6.375 | -0.555570 | -1.111140 |
| 6.500 | -0.707107 | -1.414214 |
| 6.625 | -0.831470 | -1.662939 |
| 6.750 | -0.923880 | -1.847759 |
| 6.875 | -0.980785 | -1.961571 |
| 7.000 | -1.000000 | -2.000000 |
| 7.125 | -0.980785 | -1.961571 |
| 7.250 | -0.923880 | -1.847759 |
| 7.375 | -0.831470 | -1.662939 |
| 7.500 | -0.707107 | -1.414214 |
| 7.625 | -0.555570 | -1.111140 |
| 7.750 | -0.382683 | -0.765367 |
| 7.875 | -0.195090 | -0.390181 |
| 8.000 | 0.000000 | 0.000000 |
Worked example 1
Compare two pressure traces
Problem
In the graph above, A and B each complete two cycles in 8 ms. A has pressure amplitude 1 Pa and B has amplitude 2 Pa, measured at the same listening position. Calculate their frequencies and compare their pitch and loudness.
Show full solution
Find the period and frequency
Method
Divide the time by the number of cycles, convert to seconds, then use f = 1/T.
Reason
Pitch follows frequency. Frequency counts cycles per second, so a period in milliseconds must be converted.
Working
Answer
For each trace, T = 8/2 = 4 ms = 0.004 s and f = 1/0.004 = 250 Hz.
Compare the pressure amplitudes
Method
Compare the largest pressure changes from the mean.
Reason
At the same frequency and listening position, larger pressure amplitude gives a louder sound.
Working
Answer
B’s 2 Pa amplitude is twice A’s 1 Pa amplitude. Both have the same 250 Hz frequency.
State the comparison
Working
Answer
Both frequencies are 250 Hz, so the pitch is the same. B is louder because its pressure amplitude is larger.
Sound records A and C
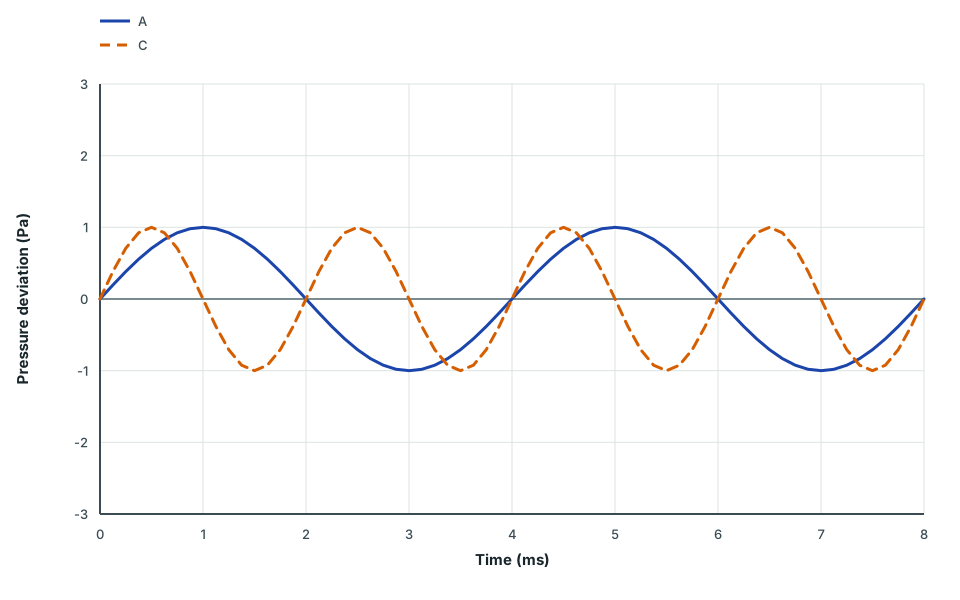
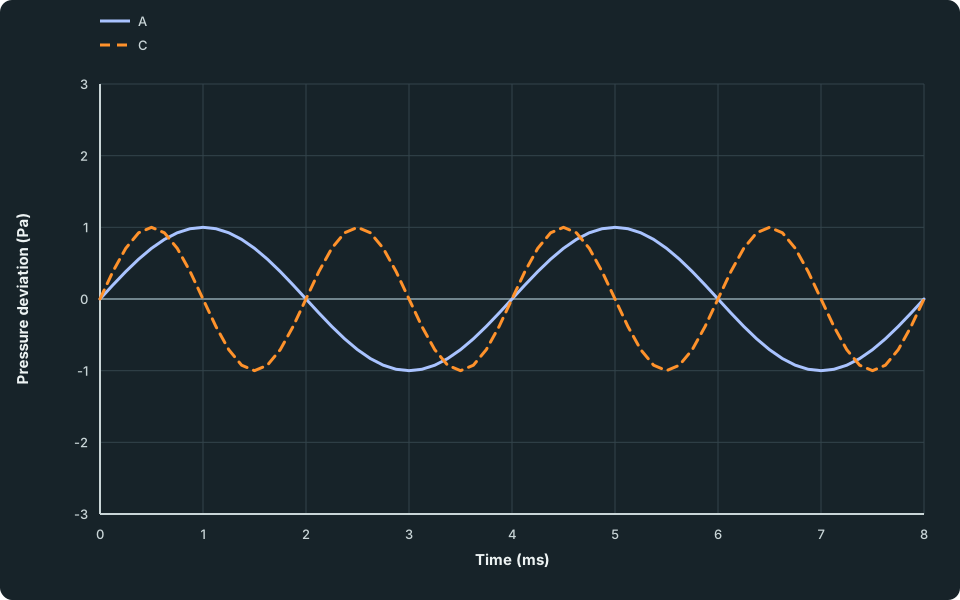
Pressure change in Pa against time in ms, from 0 ms to 8 ms, for two constructed sound models at a common listening position. Both records vary between +1 Pa and −1 Pa. Record A has maxima at 1 ms and 5 ms and completes two cycles in 8 ms; record C has maxima at 0.5, 2.5, 4.5 and 6.5 ms and completes four cycles in 8 ms.
Scroll across the figure to read all labels.
View figure data
| Time (ms) | A | C |
|---|---|---|
| 0.000 | 0.000000 | 0.000000 |
| 0.125 | 0.195090 | 0.382683 |
| 0.250 | 0.382683 | 0.707107 |
| 0.375 | 0.555570 | 0.923880 |
| 0.500 | 0.707107 | 1.000000 |
| 0.625 | 0.831470 | 0.923880 |
| 0.750 | 0.923880 | 0.707107 |
| 0.875 | 0.980785 | 0.382683 |
| 1.000 | 1.000000 | 0.000000 |
| 1.125 | 0.980785 | -0.382683 |
| 1.250 | 0.923880 | -0.707107 |
| 1.375 | 0.831470 | -0.923880 |
| 1.500 | 0.707107 | -1.000000 |
| 1.625 | 0.555570 | -0.923880 |
| 1.750 | 0.382683 | -0.707107 |
| 1.875 | 0.195090 | -0.382683 |
| 2.000 | 0.000000 | 0.000000 |
| 2.125 | -0.195090 | 0.382683 |
| 2.250 | -0.382683 | 0.707107 |
| 2.375 | -0.555570 | 0.923880 |
| 2.500 | -0.707107 | 1.000000 |
| 2.625 | -0.831470 | 0.923880 |
| 2.750 | -0.923880 | 0.707107 |
| 2.875 | -0.980785 | 0.382683 |
| 3.000 | -1.000000 | 0.000000 |
| 3.125 | -0.980785 | -0.382683 |
| 3.250 | -0.923880 | -0.707107 |
| 3.375 | -0.831470 | -0.923880 |
| 3.500 | -0.707107 | -1.000000 |
| 3.625 | -0.555570 | -0.923880 |
| 3.750 | -0.382683 | -0.707107 |
| 3.875 | -0.195090 | -0.382683 |
| 4.000 | 0.000000 | 0.000000 |
| 4.125 | 0.195090 | 0.382683 |
| 4.250 | 0.382683 | 0.707107 |
| 4.375 | 0.555570 | 0.923880 |
| 4.500 | 0.707107 | 1.000000 |
| 4.625 | 0.831470 | 0.923880 |
| 4.750 | 0.923880 | 0.707107 |
| 4.875 | 0.980785 | 0.382683 |
| 5.000 | 1.000000 | 0.000000 |
| 5.125 | 0.980785 | -0.382683 |
| 5.250 | 0.923880 | -0.707107 |
| 5.375 | 0.831470 | -0.923880 |
| 5.500 | 0.707107 | -1.000000 |
| 5.625 | 0.555570 | -0.923880 |
| 5.750 | 0.382683 | -0.707107 |
| 5.875 | 0.195090 | -0.382683 |
| 6.000 | 0.000000 | 0.000000 |
| 6.125 | -0.195090 | 0.382683 |
| 6.250 | -0.382683 | 0.707107 |
| 6.375 | -0.555570 | 0.923880 |
| 6.500 | -0.707107 | 1.000000 |
| 6.625 | -0.831470 | 0.923880 |
| 6.750 | -0.923880 | 0.707107 |
| 6.875 | -0.980785 | 0.382683 |
| 7.000 | -1.000000 | 0.000000 |
| 7.125 | -0.980785 | -0.382683 |
| 7.250 | -0.923880 | -0.707107 |
| 7.375 | -0.831470 | -0.923880 |
| 7.500 | -0.707107 | -1.000000 |
| 7.625 | -0.555570 | -0.923880 |
| 7.750 | -0.382683 | -0.707107 |
| 7.875 | -0.195090 | -0.382683 |
| 8.000 | 0.000000 | 0.000000 |
Check your understanding 1 A and C
A completes two cycles in 8 ms and C completes four cycles in 8 ms. Both have pressure amplitude 1 Pa at the same listening position. Calculate C’s frequency. Which has higher pitch?
Show the steps Optional working
Show answer
C has a period of 8 ÷ 4 = 2 ms = 0.002 s, so its frequency is 1 ÷ 0.002 = 500 Hz, twice A’s 250 Hz. C has the higher pitch. Their amplitudes are equal, but because your ear’s sensitivity depends on frequency, they need not sound equally loud.
Allow for the microphone scale
The amplitude on these graphs is a pressure amplitude: the largest change in pressure from its normal value, in pascals. A microphone turns it into a voltage, and turning up the microphone’s gain makes the trace taller without changing the sound itself.
Check your understanding 2 Different microphones
Trace A has amplitude 6 divisions at 3 divisions per pascal. Trace B has amplitude 4 divisions at 1 division per pascal. Both were recorded at the same listening position. Calculate their pressure amplitudes. Which sound has the larger pressure amplitude?
Show answer
A has pressure amplitude 6 ÷ 3 = 2 Pa; B has 4 ÷ 1 = 4 Pa. B therefore has the larger pressure amplitude, twice A’s, despite its shorter trace. A’s greater gain makes each pascal produce more divisions, so the raw trace heights cannot be compared without allowing for gain.
Check your understanding 3 Compare recordings with different time scales
D and E each show four cycles with pressure amplitude 2 Pa. D spans 8 ms; E spans 16 ms. Calculate both frequencies. Which has higher pitch? Must equal amplitudes sound equally loud at these different frequencies?
Show the steps Optional working
Show the steps Optional working
Show answer
D: period = 8/4 = 2 ms = 0.002 s, frequency = 500 Hz. E: period = 16/4 = 4 ms = 0.004 s, frequency = 250 Hz. D has the higher pitch: matching cycle counts do not mean matching rates when the time windows differ. The pressure amplitudes are equal, but equal perceived loudness does not follow here because the ear’s sensitivity depends on frequency. At the same frequency and listening position, comparing pressure amplitudes supports a louder/quieter comparison; these sounds have different frequencies.
Common mistakes
- Saying a taller trace has a higher pitch. Height shows amplitude; pitch follows frequency.
- Saying more cycles on the screen always means a higher pitch. Compare the same time interval, or work out each period from its own time scale.
- Comparing trace heights recorded with different microphone gains.
- Saying a louder note travels faster. In the same air, sound travels at the same speed; only the amplitude changes.
- Forgetting to change milliseconds to seconds before using f = 1/T.
Spotted an error? Report a correction
Syllabus and review details
- SEC G3 Combined Science Physics component 2027 · 2027
Physics section, PDF pages 8–24
Last reviewed: