Free-fall investigation
Key idea: Electronically time a ball falling from rest through several measured heights. Plot height against time squared; twice the gradient gives free-fall acceleration when air resistance is small.
Offline pages
Saved on this device only. Connect at least once every 30 days to confirm Premium. Sign-out or a change of account removes saved copies.
Loading guide controls…
Guided lessons · coming soon
Guided lesson
Guided steps
- Match the measured drop distance to the timed interval.
- Explain why the ball is already moving at the first gate.
- Use the graph’s gradient to find gravity.
- Find the measured gravity and explain the low result.
- Explain the low result and improve the timing.
- Use the pendulum equation to find what its gradient means.
- Find gravity from the graph with reversed axes.
- Draw the graph and explain what its gradient means.
On this page
You stopped at:
ContinueA ball dropped from 1 m hits the floor in under half a second, far too quickly to time well with a stopwatch. Measuring the acceleration of free fall, g, therefore needs two things: an electronic timer, and a graph of several drops whose gradient helps estimate g across scattered readings; a graph does not remove a shared timing bias. Use a stable stand and a tray to catch the ball.
Determine the acceleration of free fall
An object released from rest falls with uniform acceleration g (ignoring air resistance). Its speed–time graph is a straight line from the origin, so the distance fallen is the area of a triangle:
So a graph of s against t² is a straight line through the origin with gradient = 1/2 g, and g = 2 × gradient.
A 1 m fall takes only about 0.45 s. A delay of a few tenths of a second when starting or stopping a stopwatch is a large part of that interval. Use electronic timing if suitable apparatus is available:
- Hold a steel ball with an electromagnet above a trapdoor switch. Switching off the magnet starts an electronic timer; the ball hitting the trapdoor stops it.
- Measure s with a metre rule from the bottom of the ball to the trapdoor.
- Time three drops at each of six heights and use the mean t.
- Plot s against t² and find g from the gradient.
A light gate can stop the timer instead of the trapdoor. Measure the distance to the position of the ball’s leading edge when it triggers the gate. If the start signal comes from a gate below the release point, the ball is already moving at that gate: do not apply the released-from-rest equation to the distance between two gates.
Check your understanding 1 Starting at a light gate
A ball is released from rest 0.20 m above light gate 1, which starts the timer. Light gate 2, 0.50 m below gate 1, stops it. A student substitutes s = 0.50 m and the timer reading into s = (1/2)gt². Why is this wrong, and which distance and time would make the equation valid?
Show answer
The ball is already moving when it reaches gate 1, but the equation assumes it starts from rest at the beginning of the timed interval. Use the distance from the release point to gate 2, 0.20 + 0.50 = 0.70 m, with the time measured from release to gate 2, for example by starting the timer when the electromagnet releases the ball.
The readings below are an illustrative data set, not results from a reported experiment. The graph uses the displayed, rounded t² values.
| s / m | mean t / s | t² / s² |
|---|---|---|
| 0.300 | 0.248 | 0.0615 |
| 0.500 | 0.321 | 0.103 |
| 0.700 | 0.377 | 0.142 |
| 0.900 | 0.428 | 0.183 |
| 1.100 | 0.475 | 0.226 |
| 1.300 | 0.514 | 0.264 |
Fall distance against time squared
Plotted points of fall distance s in m against t² in s² for distances from 0.300 m to 1.300 m, with a dashed best-fit straight line through the origin. The data table lists every plotted value.
Scroll across the figure to read all labels.
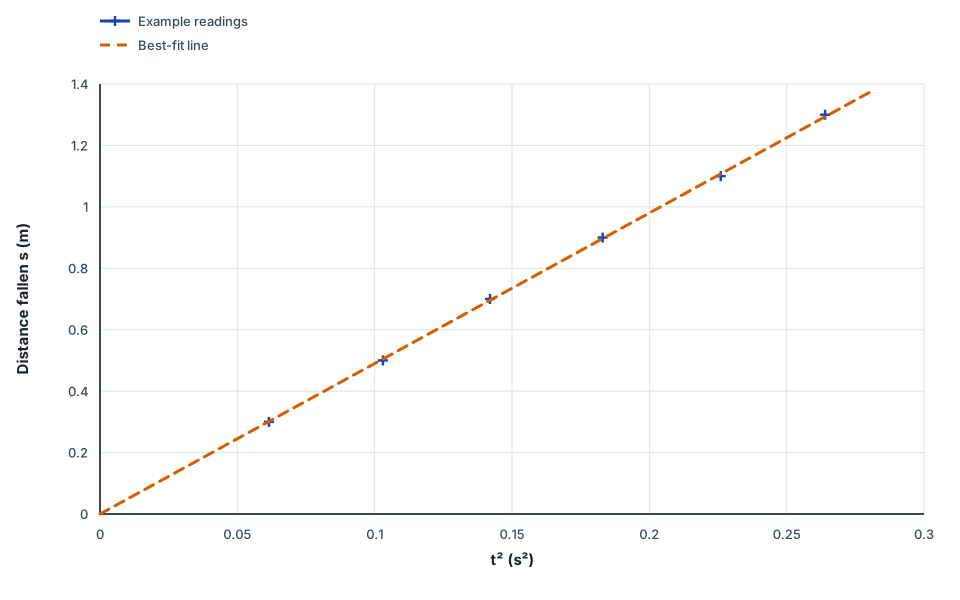
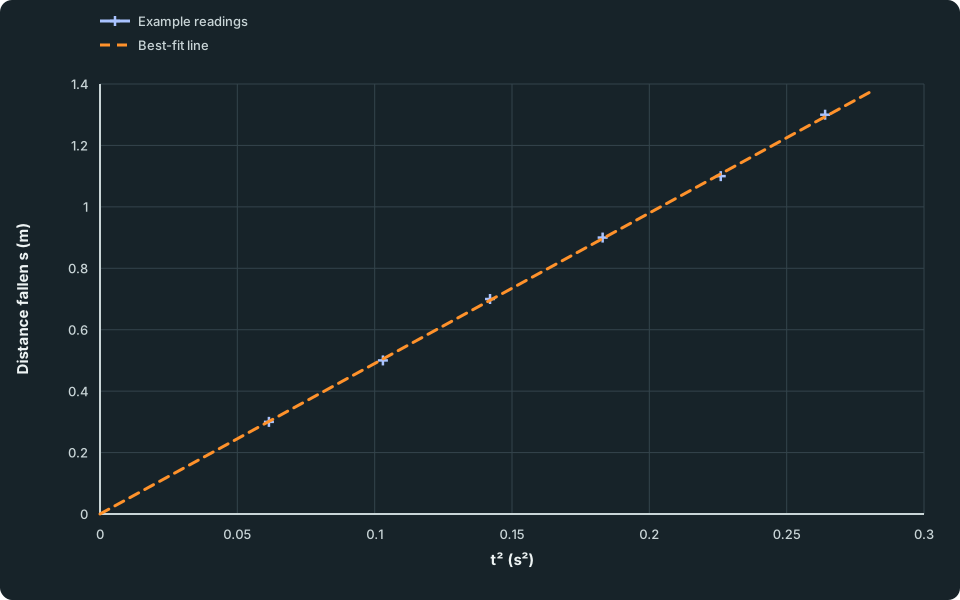
View figure data
| Series | t² (s²) | Distance fallen s (m) |
|---|---|---|
| Example readings | 0.0615 | 0.300 |
| Example readings | 0.1030 | 0.500 |
| Example readings | 0.1420 | 0.700 |
| Example readings | 0.1830 | 0.900 |
| Example readings | 0.2260 | 1.100 |
| Example readings | 0.2640 | 1.300 |
| Best-fit line | 0.0000 | 0.000 |
| Best-fit line | 0.2800 | 1.372 |
Worked example 1
Finding g from the graph
Problem
Use the best-fit line of the s against t² graph to find g.
Show full solution
Large triangle on the line
Method
Read (0.050 s², 0.245 m) and (0.250 s², 1.225 m) from the line.Reason
The points are far apart and lie on the drawn line.Working
Answer
gradient = (1.225 - 0.245)/(0.250 - 0.050) = (0.980 m)/(0.200 s²) = 4.90 m/s²Link the gradient to g
Method
Use gradient = 1/2 g.Reason
s = 1/2 g t² has the form y = (gradient) × x with y = s and x = t².
Working
Answer
g = 2 × 4.90 = 9.8 m/s²State the acceleration
Working
Answer
The graph gives g = 9.8 m/s², twice its gradient.
Quick check
Guided practice 2
Why is this value of g so low?
Problem
A student releases a small, dense ball from rest through 1.00 m, times one fall with a stopwatch as 0.60 s and calculates g = 2s/t². Find the student’s value, explain how the measured time could cause the low result and suggest an improvement.
Calculate, then explain
Hints
Hint 1
calculate first
g = 2 × 1.00 ÷ 0.60².
Hint 2
compare the times
A true fall of 1.00 m takes about 0.45 s. Which way is the student’s time wrong, and why?
Show solution step by step
The student's value
Method
Substitute into g = 2s/t².Reason
This is s = 1/2 g t² rearranged.Working
Answer
g = 2 × 1.00 ÷ 0.36 = 5.6 m/s²
Source and effect
Method
The measured interval is too long for a released-from-rest 1.00 m fall. Stopping late is one possible cause.
Reason
Since g depends on 1/t², a time that is too long gives a smaller value of g. Starting and stopping delays can partly cancel or combine; the result alone cannot identify which action was late.
Working
Answer
0.60 s instead of about 0.45 s.Improvement
Method
Time the fall electronically and use several heights.Reason
Electronic timing removes the observer’s start/stop reaction delay, while a range of heights helps reveal whether the model fits. Check the apparatus for release and detector delays as well.
Working
Answer
“Use an electromagnet release and a trapdoor switch connected to an electronic timer. Time three drops at each of six heights and find g from the gradient of s against t².”
Summarise the result and repair
Working
Answer
The student’s value is 5.6 m/s². An overlong time makes 2s/t² too small. Use checked electronic release and detection, repeated drops and a range of heights.
Quick check
A stopwatch with more decimal places does not remove reaction-time error. The displayed resolution does not include the observer’s timing uncertainty.
Check your understanding 2 Explain the low result
Why does the student’s long timing give a low value of g? Suggest an improvement and explain why more decimal places on the stopwatch would not help.
Show answer
In g = 2s/t², a larger measured time gives a smaller calculated g. Starting too early or stopping too late can make the interval too long; the result alone does not tell you which happened. Use electronic release and detection, check their delays, and repeat drops over several heights. More decimal places show smaller changes on the display but do not remove the observer’s reaction delay.
Other limitations. A small, dense ball reduces the effect of air resistance. A delay between the timer’s start signal and the ball’s actual release makes recorded times too long. A fixed timing delay can cause curvature or a displaced fitted line on an s against t² graph; it is not simply a fixed shift on the t² axis. Check the release and detection method, and do not use the fitted intercept alone to diagnose the cause.
An exam question may supply an equation for a different method. Identify what the graph’s gradient represents from that equation; it need not be half of g.
Worked example 3
Use a given pendulum equation
Problem
A question gives T² = 4π²l/g. A graph of period squared, T², against pendulum length, l, has gradient 4.02 s²/m. Calculate g from this gradient.
Show full solution
Match the equation to the axes
Method
Identify the coefficient of l in the given equation.
Reason
On a graph of T² against l, that coefficient is the gradient.
Working
Answer
gradient = 4π²/g = 4.02 s²/m.
Rearrange for the acceleration
Method
Multiply by g and divide by the gradient.Reason
Here g is in the denominator. Doubling the gradient would use the free-fall graph’s rule for the wrong axes.
Working
Answer
g = 4π²/gradient; dividing by s²/m gives m/s².
Calculate and state the result
Working
Answer
g = 4π²/4.02 = 9.82 m/s² to three significant figures.
Check your understanding 3 Check the axes before using the gradient
A question gives the released-from-rest relation s = ½gt². A learner plots time squared t² vertically against distance s horizontally, with points on the fitted line (0.40 m, 0.080 s²) and (1.20 m, 0.240 s²). Sketch and label this line on paper and find its gradient with units. The learner doubles the gradient to find g. Use the given relation to correct that rule and calculate g. State the release and timing condition the equation needs.
Show the steps Optional working
Show the steps Optional working
Show answer
The gradient on these reversed axes is (0.240 − 0.080)/(1.20 − 0.40) = 0.200 s²/m. Rearranging the given equation gives t² = (2/g)s, so gradient = 2/g and g = 2/0.200 = 10.0 m/s². Doubling the gradient would have the wrong units and use the rule for s plotted vertically instead. Self-review the paper graph: horizontal s / m, vertical t² / s², both points on the line and a large rise/run triangle. The model requires release from rest at the beginning of the timed interval and negligible air resistance; a timer starting at a lower gate does not meet that condition.
Check your understanding 4 Check the graph and equation
Draw the reversed-axes graph on paper. Explain how s = (1/2)gt² gives its gradient, and state the release and timing condition needed.
Show answer
Label the horizontal axis s / m and the vertical axis t² / s². Put (0.40, 0.080) and (1.20, 0.240) on the line, and use a large rise/run triangle. Rearrange to t² = (2/g)s: the coefficient of the horizontal variable is 2/g, so g = 2/gradient, not twice the gradient. The ball must start from rest at the beginning of the timed interval, with negligible air resistance. Starting the timer at a lower gate does not meet that condition.
Common mistakes
- Measuring the fall distance from the wrong points. Measure from the bottom of the ball to the trapdoor or detector.
- Using s = (1/2)gt² for a timed interval that starts after the ball is already moving.
- Plotting s against t instead of t² and expecting a straight line.
- Taking the gradient of s against t² as g. The gradient is (1/2)g.
- Trusting a hand-timed fall because the stopwatch shows 0.01 s. The reaction time is far larger than that.
Spotted an error? Report a correction
Syllabus and review details
- SEC G3 Combined Science Physics component 2027 · 2027
Physics section, PDF pages 8–24
Last reviewed: