G3 Science practical skills and investigations
Key idea: Prepare for the G3 Science Physics practical test through reliable measurement, fair comparisons, clear data analysis and the 11 named investigation groups.
Continue where you stopped
The core idea
G3 Science Physics · Paper 5 practical skills
A strong practical answer does more than name apparatus. It explains what you change, what you measure, how you keep the comparison fair and how the evidence supports your conclusion. This lesson applies those habits to all 11 Physics practical groups in your G3 Science course.
What you will be able to do
- choose apparatus, record repeatable measurements and present results clearly;
- determine density, free-fall acceleration, centre of gravity and resistance;
- investigate forces, moments, thermal transfer, reflection, images and refraction;
- use graphs and calculations, evaluate limitations and suggest specific improvements.
Paper 5: 1 h 30 min, 30 marks and 15% of the qualification. Online questions help you prepare, but practical skill is shown by using real apparatus safely and recording real evidence.
1. Measure and record reliably
First identify the quantity. Choose an instrument whose range includes the expected value and whose resolution is fine enough to show useful changes. More displayed digits do not automatically make a reading accurate.
Swipe the table sideways to see the technique column.
| Quantity | Suitable instrument | Good technique |
|---|---|---|
| Length | Tape, rule, digital calipers or digital micrometer | Check zero, align the scale and match the range to the object. |
| Time interval | Digital stopwatch or electronic timer | Use clear start/stop events; time many repeated events where possible. |
| Volume | Measuring cylinder | Keep it upright and read the bottom of a water meniscus at eye level. |
| Mass and weight | Electronic balance and spring balance | Zero the instrument and use the correct unit: kg or g for mass, N for weight. |
| Temperature | Laboratory thermometer | Immerse the bulb without touching the container and wait for a steady reading. |
| Current and voltage | Ammeter and voltmeter | Connect current in series and voltage in parallel; begin with a suitable range. |
- Check.Inspect the apparatus, check zero and choose a suitable range.
- Position.Align the instrument correctly and view analogue scales straight on.
- Record.Use quantity / unit headings and consistent precision in a ruled table.
- Repeat.Repeat readings when values vary; investigate an anomaly before excluding it.
- Process.Show substitutions, plot a suitable graph and use a large triangle for a gradient.
2. Mechanics investigations
Determine density
density = mass ÷ volume
- Liquid: subtract the empty container’s mass from the filled container’s mass, then divide by the measured liquid volume.
- Regular solid: measure mass and the required dimensions; repeat dimensions if the shape is not perfectly uniform.
- Irregular solid: volume = final water reading − initial water reading. Remove trapped bubbles and use the same dry sample for its mass.
Worked example: a 63.0 g solid raises water from 38.0 cm³ to 46.0 cm³. Its volume is 8.0 cm³, so density = 63.0/8.0 = 7.9 g/cm³ to two significant figures.
Determine the acceleration of free fall
- Release an object from rest through a measured vertical distance s.
- Use electronic timing or light gates to reduce reaction delay. Repeat at each of several well-spaced distances.
- Calculate t2 and plot s against t2.
- Since s = ½gt2, gradient = ½g and g = 2 × gradient.
Check your understanding: if the gradient is 4.8 m/s², g = 9.6 m/s².
Investigate balanced and unbalanced forces
Use the same trolley and level track. Measure applied and resistive forces, then use a motion sensor or light gates to determine acceleration. Change the resultant force while keeping mass and the starting method constant. Balanced forces give zero acceleration; unbalanced forces change velocity.
Independent variableresultant force
Dependent variableacceleration
Control variablesmass, track and release method
Test the principle of moments
- Balance a rule or beam on a narrow pivot and check that it is horizontal.
- Measure each force and the perpendicular distance from the pivot to its line of action.
- Compare total clockwise and anticlockwise moments, including the beam’s weight if its centre of gravity is not at the pivot.
- Repeat with different force positions and compare within measurement uncertainty.
Find the centre of gravity of a plane lamina
- Make a small hole near the edge and suspend the lamina freely from that point.
- Hang a plumb line from the same point and draw its vertical line on the lamina.
- Repeat from at least two well-separated suspension points.
- The line intersection estimates the centre of gravity; check by balancing the lamina there.
Why it works: when the lamina hangs freely, its centre of gravity lies vertically below the suspension point. Several lines reveal drawing or alignment uncertainty.
3. Investigate thermal transfer
Choose one factor such as insulation material, insulation thickness or surface finish. Change only that factor and compare temperature–time evidence under matched conditions.
- Use identical containers with the same water mass and starting temperature.
- Keep container geometry, lid, thermometer position, surroundings and timing intervals the same.
- Record temperature at equal intervals, repeat the investigation and plot both cooling curves.
- Compare temperature drop or curve gradient, then limit the conclusion to the tested conditions.
Worked comparison: cup A cools from 70 °C to 57 °C while cup B cools to 62 °C in the same 10 min. B is the better insulator under these conditions because its smaller 8 °C fall shows a lower rate of energy transfer.
4. Light investigations
Test the law of reflection
- Direct a narrow ray at a fixed plane mirror and mark the incident and reflected rays.
- Draw the normal at the point of incidence. Measure i and r from the normal.
- Repeat for several incidence angles and compare each pair.
Use a sharp ray, mark points far apart and replace the mirror on the same line. The evidence should support i = r within measurement uncertainty.
Find the position and characteristics of an optical image
Plane mirror
Move a marker behind the mirror until there is no parallax between it and the object’s image. The image is virtual, so it cannot be caught on a screen.
Thin converging lens
Form the sharpest possible image on a screen. Measure object and image distances from the lens’s optical centre and record whether the image is real/virtual, upright/inverted and magnified/diminished.
Investigate refraction through a glass block
- Trace the block and direct a narrow ray at one face. Mark two points on the incident ray and two on the emergent ray.
- Remove the block, join the marked points and draw the ray inside the outline.
- Draw the normal at the boundary and measure i and r from it.
- Repeat for several angles using the same block. If asked, compare sin i / sin r.
5. Determine the resistance of a component
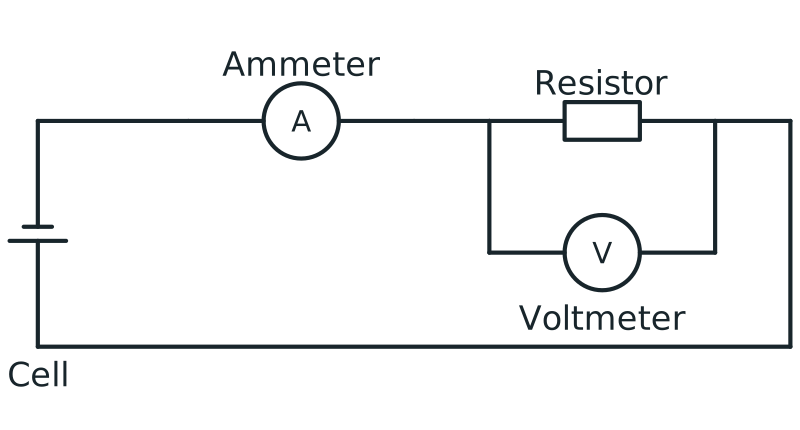
Voltmeter connection in parallel
Circuit with ammeter in series and voltmeter connected in parallel across a resistor to measure potential difference.
View figure data
| Part | Connection |
|---|---|
| Ammeter | In series in the main loop |
| Voltmeter | In parallel across the resistor |
| Resistor | In the conducting loop with the cell and ammeter |
R = V ÷ I
- Connect the ammeter in series and the voltmeter in parallel across the component.
- Have the circuit checked before switching on and begin with a low-voltage setting.
- Record paired values of potential difference V and current I.
- Collect several pairs, switching off between readings if heating could change resistance.
- Calculate R = V/I, or use the gradient of a suitable graph if asked.
Worked example: 3.6 V across a component produces 0.24 A through it, so R = 3.6/0.24 = 15 Ω. Both readings must describe the same component at the same time.
6. Practise this
- Plan: choose one investigation and state its apparatus, independent variable, dependent variable, controls and safety measure.
- Present: draw a results table with every heading written as quantity / unit.
- Analyse: state the graph to plot, what its gradient or trend means and how it answers the question.
- Evaluate: give one limitation, explain its effect and propose a specific improvement that addresses it.
- Check: return to the three opening questions and answer each in a complete sentence.
Compare your answer with a strong evaluation
In the free-fall investigation, a short travel time makes any timing delay a large percentage of the result. This can make the calculated value of g too high or too low depending on the start and stop delay. Use an electronic release and light gate, repeat at several well-spaced distances and obtain g from the gradient of s against t2. This directly reduces reaction-time uncertainty and uses all the data instead of relying on one drop.
Exam guidance
Make every method step observable. Name the apparatus, say exactly what is measured, show how the comparison is kept fair and explain how the processed result supports the conclusion. For evaluation, write source → effect → improvement; avoid vague phrases such as “human error” or “be more careful”.
Continue with the next resource in this course.
Course and syllabus information
- Course
- SEC G3 Combined Science Physics component
- Edition
- SEC G3 Combined Science Physics component 2027