Uncertainty in a graph gradient
Key idea: The steepest and shallowest lines allowed by all the error bars bound a graph's gradient. Half the difference between their gradients gives the gradient's uncertainty.
Offline pages
Saved on this device only. Connect at least once every 30 days to confirm Premium. Sign-out or a change of account removes saved copies.
Loading guide controls…
Guided lessons · coming soon
Guided lesson
Guided steps
- Read how the error boxes set the steepest and shallowest lines.
- Follow both extreme gradients and find half their difference.
- Draw your lines, then find the velocity and its uncertainty.
- Compare your corners, slope triangles and reported result.
- Read why every error bar restricts the line.
- Check whether the old lines fit the middle error bar.
- Draw new lines through all three regions and calculate their gradients.
- Explain which two regions set each extreme gradient.
- Correct the uncertainty and test the proposed steeper line.
On this page
You stopped at:
ContinueIn many experiments the result you want is the gradient of a straight-line graph: a resistance from a V–I graph, a speed from a position–time graph. Each plotted point has an uncertainty, shown by its error bars, so the gradient has an uncertainty too. This lesson shows how to find it by drawing the steepest and shallowest lines the error bars allow.
The steepest and shallowest lines
A gradient is (Δ y)/(Δ x) = (y₂-y₁)/(x₂-x₁). To make it as large as possible, make the rise as large as possible and the run as small as possible. For a line with a positive gradient, that means using the bottom right corner of the error box around the lower point and the top left corner of the box around the upper point. The shallowest line uses the opposite corners: top left of the lower point and bottom right of the upper point.
Both lines must still intersect every error box (or every vertical error bar if horizontal uncertainty is negligible). Find the best-fit gradient using the whole data set, then find the limiting gradients using large triangles on the drawn lines. In the examples here, take half the difference between the limiting gradients as the uncertainty. This half-range convention summarises the allowed slopes; the best-fit value need not be exactly the midpoint.
Worked example 1
Resistance from two points
Problem
The potential difference V across a resistor is measured at two currents I:
| Point | I / A | V / V |
|---|---|---|
| 1 | 0.20±0.01 | 2.10±0.05 |
| 2 | 0.80±0.01 | 8.40±0.05 |
The resistance R is the gradient of the straight line through them. Find R and its uncertainty.
Show full solution
Find the best gradient
Method
Use the measured values.Reason
The line through the central points gives the best value.Working
Answer
R = (8.40-2.10)/(0.80-0.20) = 6.30/0.60 = 10.5 Ω
Find the steepest line
Method
Move point 1 down and right, and point 2 up and left.Reason
This gives the largest rise over the smallest run.Working
Answer
Rₘₐₓ = (8.45-2.05)/(0.79-0.21) = 6.40/0.58 = 11.03 Ω
Find the shallowest line
Reason
The opposite corners give the smallest rise over the largest run.Working
Answer
Rₘᵢₙ = (8.35-2.15)/(0.81-0.19) = 6.20/0.62 = 10.00 Ω
State the result
Working
Answer
Δ R = (Rₘₐₓ-Rₘᵢₙ)/2 = (11.03-10.00)/2 = 0.52 Ω, so R = (10.5±0.5) Ω.
Quick check
The small-uncertainty rules for derived quantities give approximately the same answer: (Δ R)/R = 0.10/6.30 + 0.02/0.60 = 0.049, so Δ R = 0.049 × 10.5 = 0.52 Ω.
Coordinate allowances and limiting gradients
Two measured current and voltage points with horizontal and vertical allowances. A central-point line and two limiting lines show how changing both coordinate differences changes their gradient. The model allows a free intercept and separately varying coordinate allowances.
Scroll across the figure to read all labels.
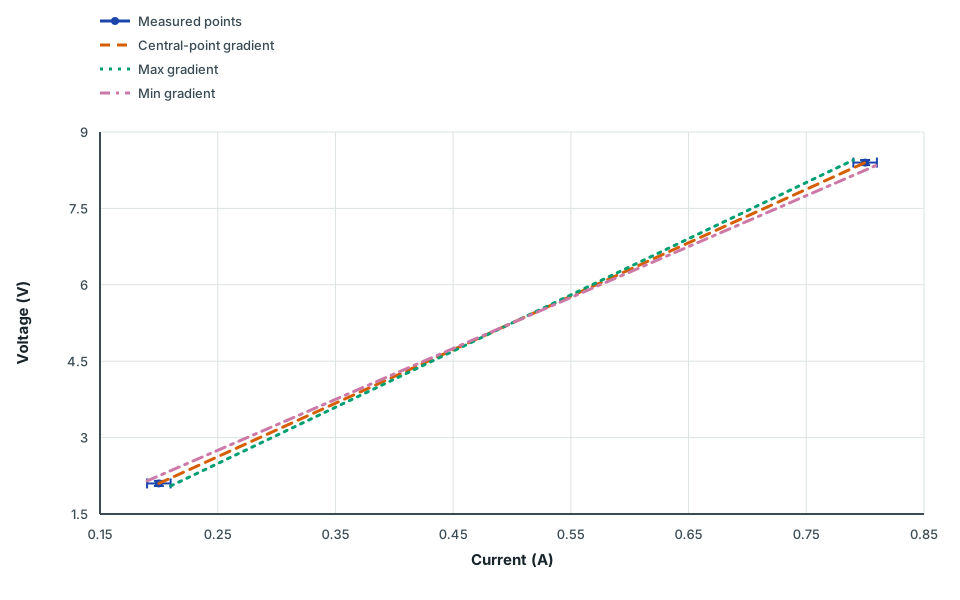
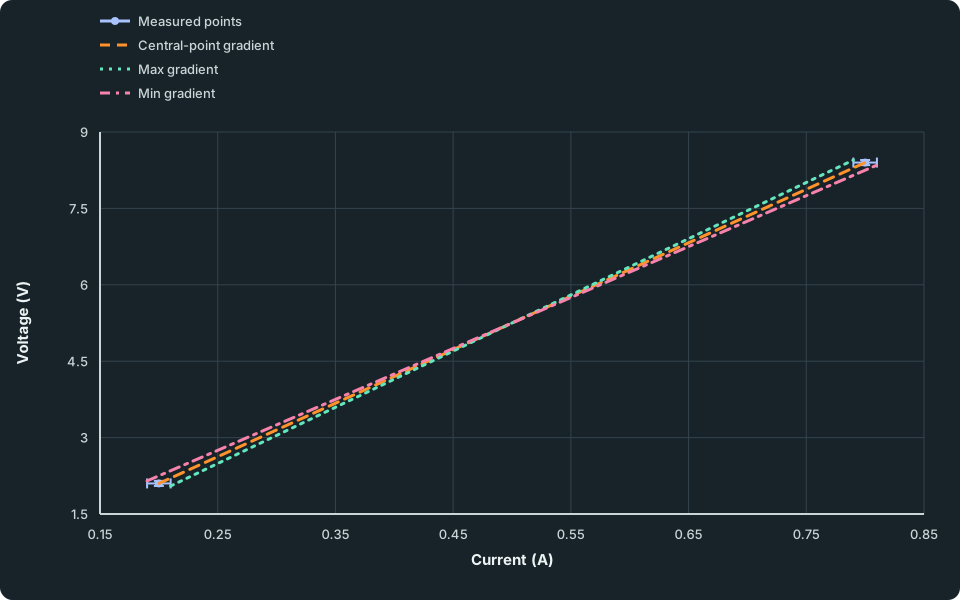
Inspect either measured point and its coordinate allowances, then compare the horizontal and vertical separations of the limiting lines.
Optional interaction loads only after you choose Explore graph.
View figure data
| Series | Current (A) | Current uncertainty | Voltage (V) | Voltage uncertainty |
|---|---|---|---|---|
| Measured points | 0.20 | 0.01 | 2.10 | 0.05 |
| Measured points | 0.80 | 0.01 | 8.40 | 0.05 |
| Central-point gradient | 0.20 | 2.10 | ||
| Central-point gradient | 0.80 | 8.40 | ||
| Max gradient | 0.21 | 2.05 | ||
| Max gradient | 0.79 | 8.45 | ||
| Min gradient | 0.19 | 2.15 | ||
| Min gradient | 0.81 | 8.35 |
The axes are zoomed in around the readings, so they do not start at zero.
Try it yourself 2
Velocity from a position–time graph
Problem
A trolley moves at constant velocity. Its position x is recorded at two times t: (3.00±0.05) s, (0.50±0.02) m and (8.00±0.05) s, (4.50±0.02) m. Draw the central and limiting lines on paper. Find the largest rise and smallest run for the steepest line, both limiting gradients, the central velocity and its uncertainty. Enter the rise and run to two decimal places, and the half-range uncertainty to two significant figures.
Find the velocity and its uncertainty
Show the steps Optional working
Show the steps Optional working
Show the steps Optional working
Hints
Hint 1
same construction
What does the gradient of a position–time graph tell you?
Show solution step by step
Best and limiting gradients
Method
Find the central, steepest and shallowest gradients.Reason
The velocity is the gradient of the position–time graph.Working
Answer
v = 4.00/5.00 = 0.800 m s⁻¹, vₘₐₓ = (4.52-0.48)/(7.95-3.05) = 4.04/4.90 = 0.824 m s⁻¹ and vₘᵢₙ = (4.48-0.52)/(8.05-2.95) = 3.96/5.10 = 0.776 m s⁻¹.
State the result
Working
Answer
Δ v = (0.824-0.776)/2 = 0.024 m s⁻¹, so v = (0.80±0.02) m s⁻¹.
Check your understanding 1
Compare your position–time construction. Which corners define each limiting line, and why do they give the extremes? Keep your graph on paper; notes are optional.
Show answer
The steepest line joins (3.05,0.48) to (7.95,4.52): bottom right of the early box to top left of the late box. It maximises rise and minimises run. The shallowest joins (2.95,0.52) to (8.05,4.48): the reverse corners. Compare axis units, both boxes, a labelled triangle on each line and the half-range allowance. Report (0.800±0.024) m s⁻¹ before rounding, or (0.80±0.02) m s⁻¹ with a one-significant-figure allowance.
More than two points
With more readings, the steepest and shallowest lines must pass through the error bars of every point, not just the two at the ends. A point in the middle can rule out a line that the end points allow.
Check your understanding 2
A third reading is added to the resistor data: at exactly 0.50 A, the potential difference is (5.30±0.01) V. Both the steepest and the shallowest lines above pass through 5.25 V at 0.50 A. Can they still be used?
Show answer
No. The third point’s error bar runs from 5.29 to 5.31 V, and 5.25 V is outside it. Both lines must be redrawn so that they also pass through this error bar.
Try it yourself 3
Redraw the lines with a third constraint
Problem
Use the same two resistor error boxes and the third reading (0.50 A,(5.30±0.01) V). Draw the new limiting lines on paper, checking all three regions. Calculate the largest and smallest acceptable gradients in ohms to two decimal places, and their half-range uncertainty to two significant figures. The current of the third reading is exact.
Calculate from your new lines
Show the steps Optional working
Hints
Hint 1
three constraints
A limiting line touches boundaries of two regions and must still intersect the third. Test which pair restricts each slope.Show solution step by step
Largest acceptable slope
Method
Join the middle lower end to the upper box’s top-left corner.Reason
The middle reading now prevents the old end-to-end steepest line.Working
Answer
Join the middle lower end (0.50,5.29) to the upper box’s top-left corner (0.79,8.45). The slope is (8.45-5.29)/(0.79-0.50) = 10.8966 Ω. At I = 0.21 A, it gives V = 2.13 V, inside the lower box. A steeper line would miss either the middle bar or the upper box.
Smallest acceptable slope
Method
Join the lower box’s top-left corner to the middle lower end.Reason
A shallower line cannot reach the middle bar while intersecting the lower box.Working
Answer
Join (0.19,2.15), the lower box’s top-left corner, to (0.50,5.29). The slope is (5.29-2.15)/(0.50-0.19) = 10.1290 Ω. At I = 0.81 A, it gives V = 8.43 V, inside the upper box. A shallower line would miss the lower box or the middle bar.
Summarise the allowed range
Working
Answer
Δ R = (10.8966-10.1290)/2 = 0.384 Ω, about 0.4 Ω. The middle reading narrows the range of slopes; you must also redraw the best-fit line through the full set rather than retain the old central line, which misses the new bar.
Check your understanding 3
Explain how you know each new limiting line is acceptable. Keep your construction on paper and record any revision you need.
Show answer
Compare all three intersections, the two boundary contacts of each limiting line, large gradient triangles and axis units. The maximum is constrained by the middle bar and upper box; the minimum by the lower box and middle bar. Merely joining extreme corners of the end boxes is insufficient.
A systematic error affects the graph in its own way. For a voltage–current graph, a fixed voltage zero error adds the same amount to every voltage reading. It shifts the line vertically, changing the intercept but not the gradient.
Common mistakes
- Moving both points apart horizontally to get the steepest line. That makes the run larger and the gradient smaller.
- Drawing limiting lines that miss the error bars of some points.
- Giving the difference between the steepest and shallowest gradients as the uncertainty. For the half-range convention used here, take half of it.
- Reading the gradient from a small triangle, or from data points instead of the line.
Before you move on
Check your understanding 4
A position–time graph has acceptable limiting gradients of 4.6 and 5.8 m s⁻¹. A learner reports a velocity uncertainty of 1.2 m s⁻¹. Correct it. The learner then finds a line with gradient 6.0 m s⁻¹ that passes through the end error bars but misses a middle error bar. Can this replace the steepest line?
Show the steps Optional working
Show answer
The uncertainty is half the allowed gradient range: (5.8-4.6)/2 = 0.6 m s⁻¹. The proposed 6.0 m s⁻¹ line is unacceptable because it misses one of the error bars; passing through only the end bars is insufficient.
Spotted an error? Report a correction
Syllabus and review details
- GCE A-Level H2 Physics 2027 · 2027
Content Overview, PDF pages 9–10; Subject Content, PDF pages 11–30
Last reviewed: