I–V graph of a metallic conductor
Key idea: At constant temperature, current in a metallic conductor is proportional to p.d. Its I-against-V graph is a straight line through the origin with gradient 1/R.
Loading guide controls…
Guided lessons · coming soon
More
Offline pages
Saved on this device only. Connect at least once every 30 days to confirm Premium. Sign-out or a change of account removes saved copies.
Guided steps
- Read the constant-temperature graph, including its negative half.
- Use the fixed resistance to predict current.
- Divide voltage by current at the same non-zero point.
- Find the gradient, then take its reciprocal for resistance.
- Read the swapped axes and choose what their gradient represents.
- Calculate resistance and decide what two readings can tell you.
- Read the lab instructions before testing the fixed resistor.
- Predict both currents and convert amperes to milliamperes before testing.
- Compare readings, units and both halves of the graph.
- Review temperature, axes and units, then go to the topic check.
On this page
You stopped at:
ContinueRevision Mode is on. Questions and activities are hidden.
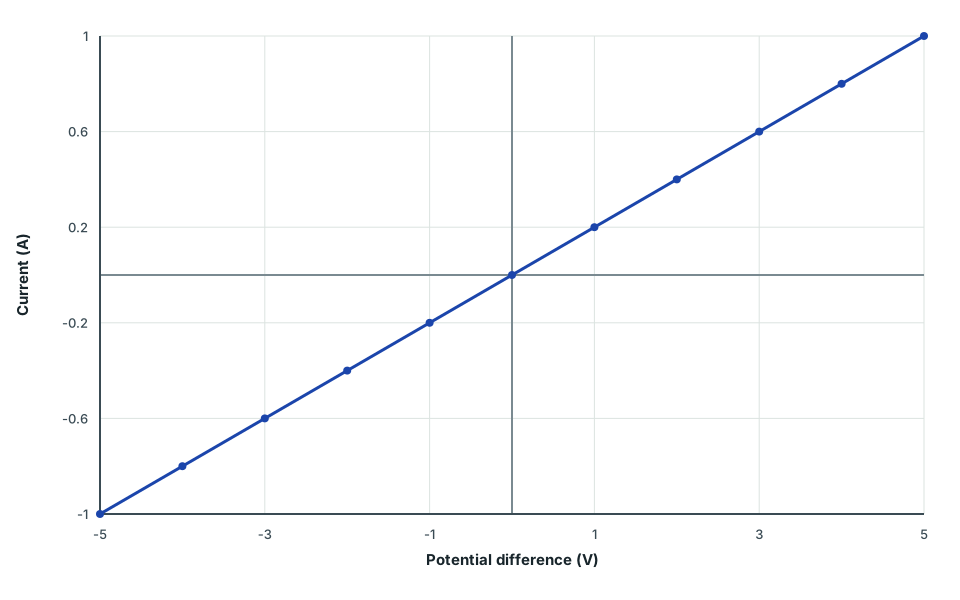
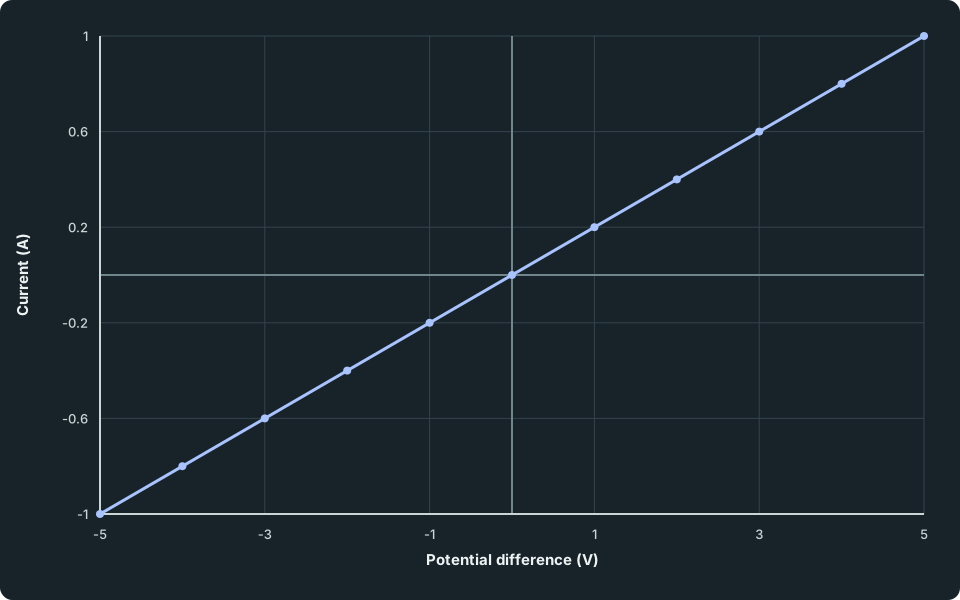
An I–V graph shows how the current I through a component changes as the p.d. V across it changes. For a metal wire or a fixed resistor at constant temperature, it is the simplest possible graph: a straight line through the origin.
A straight line through the origin
At constant temperature, the ions in a metal vibrate by the same amount whatever the current, so the resistance stays the same. With R constant, I = V/R means the current is directly proportional to the p.d.: double the p.d. and the current doubles. That is Ohm’s law, and a component that obeys it is called ohmic.
Reversing the p.d. reverses the current by the same amount, so the line continues through the origin into the negative quarter of the graph. Sketch both halves unless the axes show only one.
I–V graph for a metallic conductor (ohmic)
A straight-line I–V graph through the origin for an ohmic conductor at constant temperature.
If the figure is wider than its frame, scroll across to read all labels.
View figure data
This table is included in print while it is open.
| Potential difference (V) | Ohmic conductor |
|---|---|
| -5 | -1.0 |
| -4 | -0.8 |
| -3 | -0.6 |
| -2 | -0.4 |
| -1 | -0.2 |
| 0 | 0.0 |
| 1 | 0.2 |
| 2 | 0.4 |
| 3 | 0.6 |
| 4 | 0.8 |
| 5 | 1.0 |
The temperature condition matters. A wire that carries a large current heats up, its resistance rises, and the graph starts to bend, as a filament lamp’s does. In an experiment, keep the current small or switch off between readings so the wire stays cool.
Guided practice 1
Predict the current
Problem
A metal resistor has resistance 5.0 Ω and is kept at constant temperature. Find the current at 2.0 V.
Use the constant resistance
Hints
Hint 1
use the graph condition
At constant temperature the resistance stays 5.0 Ω.
Hint 2
calculate current
Divide 2.0 V by 5.0 Ω.
Show full solution
Predict the current
Method
Divide the p.d. by the constant resistance.Reason
The straight-line graph obeys I = V/R.Working
Answer
I = (2.0 V)/(5.0 Ω) = 0.40 A
Quick check
Find the resistance from the graph
From a point. Choose a point on the line well away from the origin, read its p.d. and current, and calculate R = V/I. The origin itself is no use: there V/I is 0/0.
Worked example 1
Resistance from a point
Problem
A point on the straight line of an I–V graph is (V,I) = (3.0 V, 0.60 A). Find the resistance.
Show full solution
Read the coordinates in axis order
Method
Take V = 3.0 V and I = 0.60 A.Reason
Resistance is p.d. divided by current, so check which value is which.Working
Answer
The point is (V,I), not (I,V).Calculate the resistance
Method
Divide the p.d. by the current.Reason
For an ohmic conductor every point on the line gives the same ratio.Working
Answer
R = (3.0 V)/(0.60 A) = 5.0 Ω
Quick check
Another point on the same line, such as (6.0 V, 1.20 A), gives the same 5.0 Ω.
From the gradient. On a graph of I against V, the gradient is Δ I/Δ V. For a straight line through the origin this equals I/V, which is 1/R. So the resistance is 1/gradient, not the gradient itself. A steeper line means more current for each volt, so a smaller resistance.
Try it yourself 1
Resistance from the gradient
Problem
A straight I-against-V line through the origin passes through (1.6 V,0.20 A) and (6.4 V,0.80 A). Use the gradient between these points to find the resistance.
Find the gradient, then the resistance
Show the steps Optional working
Hints
Hint 1
calculate rise over run
Use Δ I/Δ V for these axes.
Hint 2
then invert
The gradient is 1/R.
Show solution step by step
Find the gradient
Method
Divide the change in current by the change in p.d.Reason
Two points far apart give a more reliable gradient than one point close to the origin.Working
Answer
(Δ I)/(Δ V) = (0.80 A-0.20 A)/(6.4 V-1.6 V) = 0.125 A/VInvert the gradient
Method
Take the reciprocal.Reason
With I plotted against V, the gradient is 1/R.Working
Answer
R = 1/(0.125 A/V) = 8.0 Ω
Quick check
Check your understanding 1 Swap the axes
If you plot V against I instead, what does the gradient of the straight line represent?
Show answer
The resistance. The gradient is now Δ V/Δ I = V/I = R.
Test whether a conductor is ohmic
Calculate V/I from each measured pair. Matching values are consistent with constant resistance at those points. To check the behaviour between two readings, take separated readings across the proposed range and check the shape as well as the ratios. Keep temperature fixed.
Spot the mistake 1
Do two readings prove it?
Learner response
At constant temperature, a student records (2.0 V,0.20 A) and (4.0 V,0.40 A), then says these two points prove the conductor is ohmic at every p.d. What is wrong with the claim?
Test the measured ratios first
Show solution step by step
Check the two readings
Method
Both points give the same resistance.Reason
Doubling the p.d. doubled the current, as Ohm’s law predicts.Working
Answer
(2.0 V)/(0.20 A) = (4.0 V)/(0.40 A) = 10 ΩLimit the conclusion
Method
The readings are consistent with Ohm’s law at the two measured points. Readings between and beyond them still need testing.Reason
Two points always lie on some straight line. To show the graph is a straight line through the origin, take several readings across the whole range, including negative p.d.Working
Answer
Consistent with the same resistance at these two measured points
Common mistake
Measure the characteristic
Try it in the lab below: vary the p.d. across the fixed resistor, record the current at several values, and check whether V/I stays the same.
Check your understanding 2 Predict before testing
The lab’s fixed resistor is 20 Ω. For p.d.s of +2.0 V and −2.0 V across this resistor, predict both currents in amperes. Also convert the positive current to milliamperes for the recorded table. Write your predictions before using the controls.
Show the steps Optional working
Show answer
I = 2.0/20 = 0.10 A = 100 mA. At −2.0 V, current is −0.10 A. The current and voltage reverse together, so V/I stays positive.
Testing a fixed 20 ohm resistor with a 2.0 volt supply. The voltmeter reads 1.99 volts and the ammeter 99.7 milliamperes.
- p.d. across it, V
- 1.99 V
- Current, I
- 0.0997 A
- Resistance, V / I
- 20.0 Ω
Try this
0 of 4 doneRecord at least five readings for the fixed resistor, from 0 V to at least 5 V. (not done yet)
The points lie on a straight line through the origin: I is proportional to V, so the resistance is constant (ohmic).
Do the same for the filament lamp and compare the two graphs. (not done yet)
The curve bends towards the V-axis: as the filament heats up its resistance rises, so each extra volt adds less current.
Test the diode in both directions, including readings above 0.6 V forwards. (not done yet)
A diode conducts in one direction only, and only once the forward p.d. passes about 0.7 V. In reverse its resistance is very large.
Record the thermistor at the same supply p.d. at 20 °C and at 80 °C. (not done yet)
The hotter thermistor carries more current at the same p.d.: an NTC thermistor's resistance falls as its temperature rises.
You’ve tried every task.
Your readings
| # | V / V | I / mA | Remove |
|---|---|---|---|
| No readings yet. Set up a measurement, then record it. | |||
Check your understanding 3 Compare the recorded characteristic
Choose Fixed resistor (20 Ω) in Component under test. Use Supply p.d. to record separated readings, including 2 V and 4 V, then use Reverse the supply. Read p.d. across it, V and Current, I, and use Record V and I. Compare the table’s milliamperes with the amperes readout. Sketch both halves of I against V and explain its slope and resistance. You may use the written model below if interaction is unavailable.
Show answer
The readings are approximately (+2 V, +0.10 A), (+4 V, +0.20 A) and (−2 V, −0.10 A); the table currents are about +100, +200 and −100 mA. Use measured p.d. across the resistor when calculating V/I. At each non-zero point it is about 20 Ω. Both signs lie on one straight line through the origin, with gradient 1/R = 0.050 A/V. Convert a table current from mA to A before dividing. Label voltage horizontally and current vertically, with units and both signs; at the origin 0/0 is undefined.
Common mistakes
- Leaving out “at constant temperature” when stating Ohm’s law.
- Calling the gradient of an I-against-V graph the resistance; it is 1/R.
- Using the origin, or a point read off the line carelessly, to find V/I.
- Sketching only the positive half when the axes include negative values.
Loading reading progress…
Spotted an error? Report a correction