Reading curved motion graphs
Key idea: On a displacement–time curve, the sign of the gradient gives the direction and its steepness gives the speed. A tangent gives the velocity at an instant; a chord gives only the average.
Offline pages
Saved on this device only. Connect at least once every 30 days to confirm Premium. Sign-out or a change of account removes saved copies.
Loading guide controls…
Guided lessons · coming soon
Guided lesson
Guided steps
- Read gradient sign for direction and steepness for speed.
- Compare the velocity’s sign with its size.
- Read direction from the sign and speed from gradient size.
- Compare the whole-journey average with velocity at one instant.
- Calculate both averages and decide when the object rests.
- Compare velocity and acceleration before and after the turn.
- Calculate interval accelerations and test whether they could be constant.
On this page
You stopped at:
ContinueReal motion rarely gives straight lines. When a graph curves, its gradient changes from moment to moment, and the words you use to describe it need more care. Check the vertical axis first: the gradient gives velocity on a displacement–time graph and acceleration on a velocity–time graph. The curve is a record of motion against time, not a picture of the object’s path.
Read direction and speed separately
The gradient of a displacement–time graph is the velocity, so it carries two pieces of information:
- its sign gives the direction: positive means moving in the positive direction, negative means moving back;
- its steepness (the size of the gradient, ignoring the sign) gives the speed.
A zero gradient means the velocity is zero at that instant. A horizontal section means the object stays at rest for that time.
Keep the two apart. “The gradient increases” and “the object speeds up” are different statements. A gradient that changes from -4 to -2 m s⁻¹ increases as a signed number, but it gets less steep: the object slows down. A gradient that changes from + 2 to + 4 m s⁻¹ increases and gets steeper: the object speeds up.
A changing displacement–time gradient
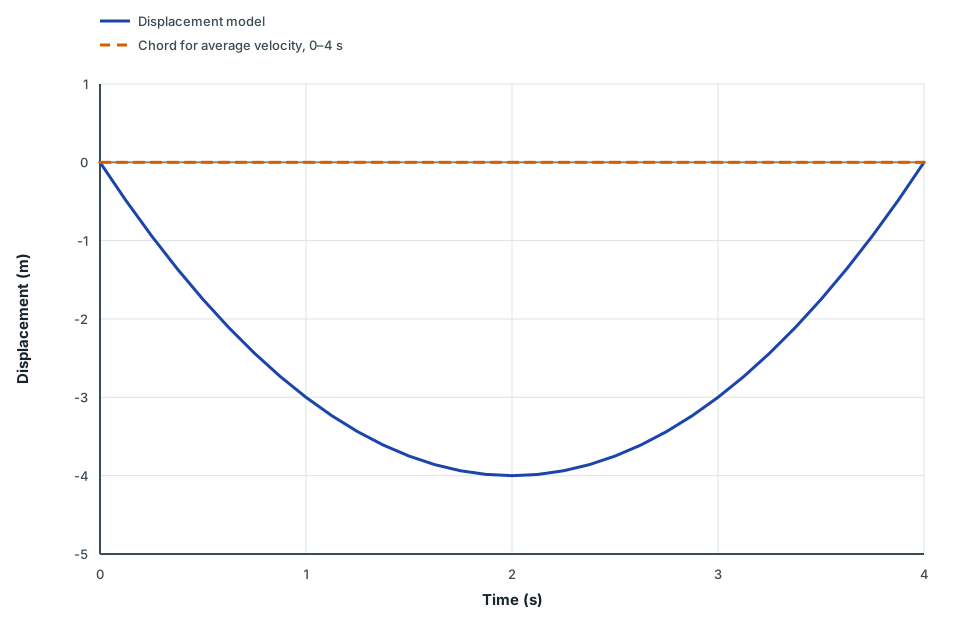
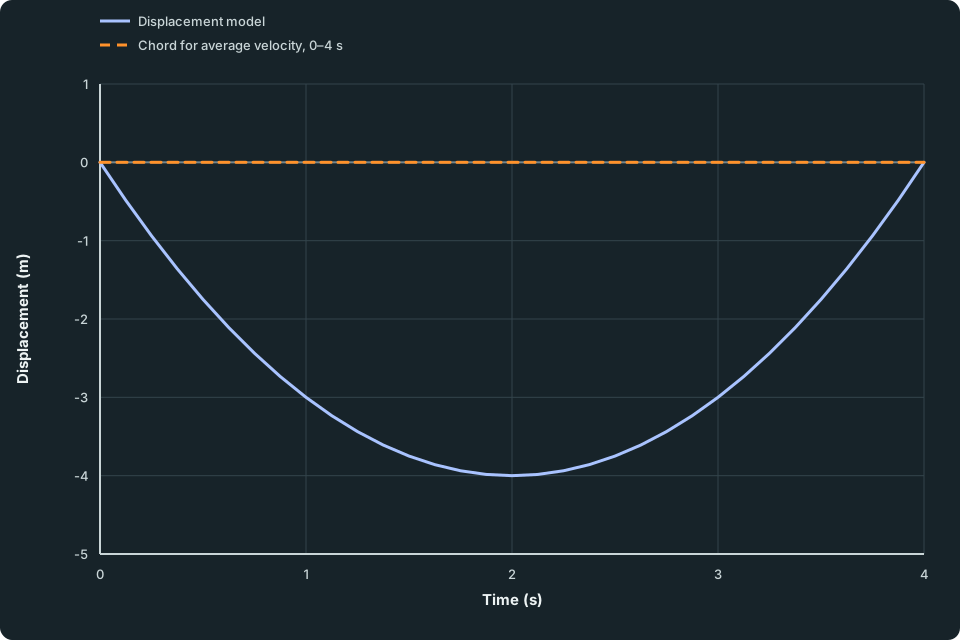
An illustrative displacement curve starts at zero metres, falls to minus four metres at two seconds, then returns to zero at four seconds. Its tangent is horizontal only at two seconds. A horizontal dashed chord joins the two endpoints.
Scroll across the figure to read all labels.
View figure data
| Series | Time (s) | Displacement (m) |
|---|---|---|
| Displacement model | 0.000 | 0.000000 |
| Displacement model | 0.125 | -0.484375 |
| Displacement model | 0.250 | -0.937500 |
| Displacement model | 0.375 | -1.359375 |
| Displacement model | 0.500 | -1.750000 |
| Displacement model | 0.625 | -2.109375 |
| Displacement model | 0.750 | -2.437500 |
| Displacement model | 0.875 | -2.734375 |
| Displacement model | 1.000 | -3.000000 |
| Displacement model | 1.125 | -3.234375 |
| Displacement model | 1.250 | -3.437500 |
| Displacement model | 1.375 | -3.609375 |
| Displacement model | 1.500 | -3.750000 |
| Displacement model | 1.625 | -3.859375 |
| Displacement model | 1.750 | -3.937500 |
| Displacement model | 1.875 | -3.984375 |
| Displacement model | 2.000 | -4.000000 |
| Displacement model | 2.125 | -3.984375 |
| Displacement model | 2.250 | -3.937500 |
| Displacement model | 2.375 | -3.859375 |
| Displacement model | 2.500 | -3.750000 |
| Displacement model | 2.625 | -3.609375 |
| Displacement model | 2.750 | -3.437500 |
| Displacement model | 2.875 | -3.234375 |
| Displacement model | 3.000 | -3.000000 |
| Displacement model | 3.125 | -2.734375 |
| Displacement model | 3.250 | -2.437500 |
| Displacement model | 3.375 | -2.109375 |
| Displacement model | 3.500 | -1.750000 |
| Displacement model | 3.625 | -1.359375 |
| Displacement model | 3.750 | -0.937500 |
| Displacement model | 3.875 | -0.484375 |
| Displacement model | 4.000 | 0.000000 |
| Chord for average velocity, 0–4 s | 0.000 | 0.000000 |
| Chord for average velocity, 0–4 s | 4.000 | 0.000000 |
This curve falls from 0 m to -4 m, then rises back to 0 m. From 0 to 2 s the gradient is negative and becomes less steep: the object moves in the negative direction and slows down. At 2 s the gradient is zero and the object stops for an instant. After 2 s the gradient is positive and becomes steeper: the object has turned round and speeds up in the positive direction.
From 2 to 4 s the displacement is still negative, but the velocity is positive. The object is on the negative side of its start while moving in the positive direction.
Worked example 1
The gradient increases while the object slows down
Problem
On a displacement–time curve, the gradient changes smoothly from -5.0 m s⁻¹ to -1.0 m s⁻¹ without changing sign. Describe the direction of motion and how the speed changes.
Show full solution
Use the sign for direction
Method
Read both gradients as negative velocities.Reason
The gradient of a displacement–time graph is the velocity, including its direction.
Working
Answer
The object moves in the negative direction throughout.
Use the steepness for speed
Method
Compare 5.0 with 1.0 m s⁻¹.Reason
Speed is the size of the velocity, without its sign.
Working
Answer
The speed falls from 5.0 to 1.0 m s⁻¹. The object slows down, even though its signed velocity increases.
Quick check
Check your understanding 1 A steeper downward curve
On a displacement–time graph, the gradient changes from −2.0 to −6.0 m/s without changing sign. Describe the motion and the change in signed velocity.
Show answer
The object moves in the negative direction and speeds up from 2.0 to 6.0 m s⁻¹. Its signed velocity decreases: it becomes more negative. “Steeper” describes the speed, so always state the direction as well.
Average velocity or velocity at one instant?
A straight line joining two points on a displacement–time curve is called a chord. Its gradient gives the average velocity between those two times:
A tangent is a straight line with the same direction and gradient as the curve at the selected point. Its gradient gives the velocity at that instant. Because the gradient of a curve changes along it, a long chord can differ a lot from the tangent at either end. As both endpoints of a chord approach a selected point on a smooth curve, its gradient approaches the tangent’s gradient there.
On the curve above, the dashed chord from 0 to 4 s is horizontal: the average velocity over 0–4 s is zero, because the object finishes where it started. The object was moving for almost the whole time. The chord tells you about the whole interval, not about any one moment.
Check your understanding 2 Zero average velocity or at rest?
Displacement is 2 m at 0 s, rises to 8 m at 3 s, then falls to 2 m at 6 s. The tangent is horizontal only at 3 s; there is no horizontal section. Find average velocity over 0–6 s and 3–6 s. Does zero average mean continuous rest?
Show answer
From 0 to 6 s:
From 3 to 6 s:
The zero average over the whole journey comes from returning to the same position, not from staying there. The object is instantaneously at rest at 3 s because the tangent has zero gradient. It does not stay at rest for any interval because the curve has no horizontal section.
Recognise non-uniform acceleration
On a velocity–time graph, the height gives the velocity and the gradient gives the acceleration. A curved section has a changing gradient, so the acceleration is non-uniform. To decide whether the object speeds up or slows down, compare the directions of velocity and acceleration.
A velocity–time curve with changing acceleration
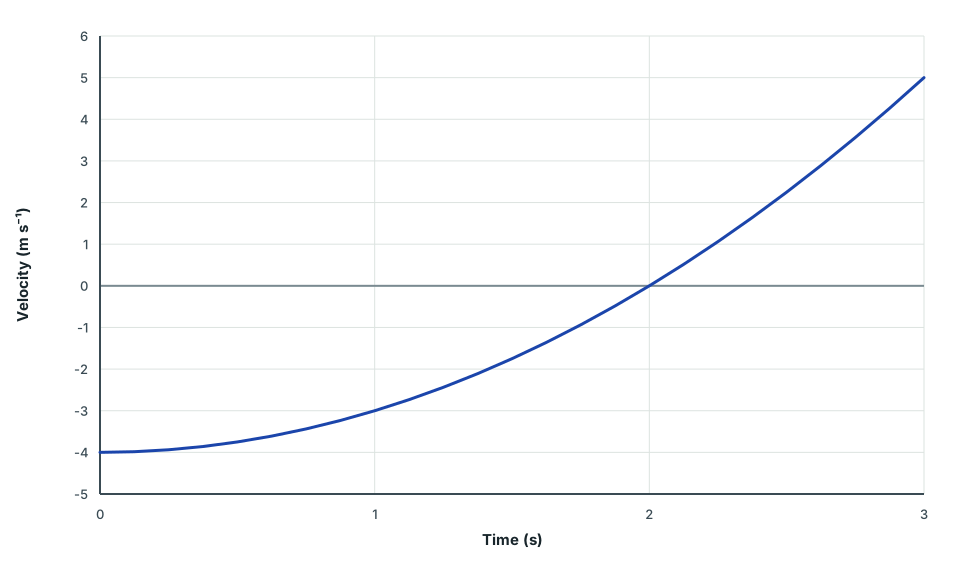
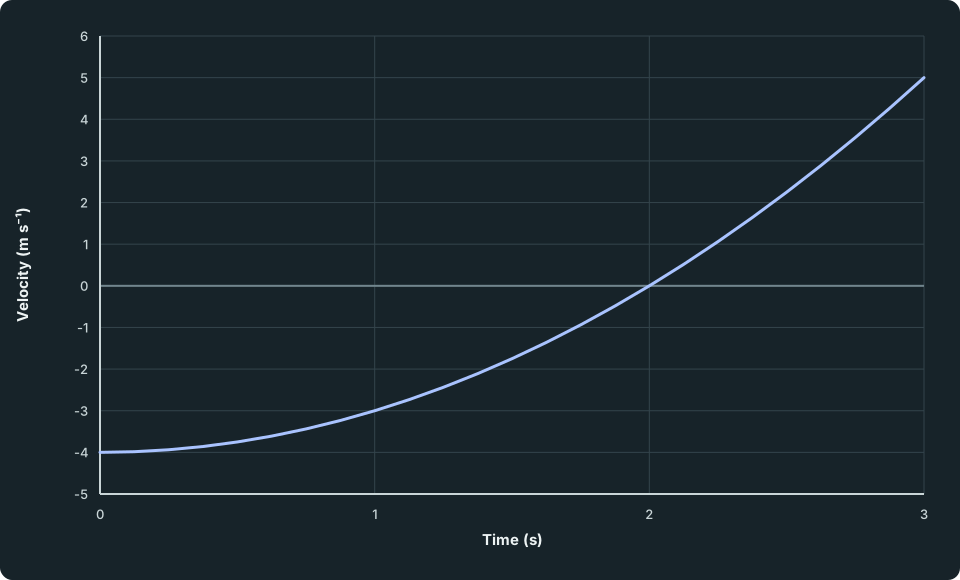
An illustrative velocity curve rises from minus four metres per second at zero seconds, through zero at two seconds, to plus five metres per second at three seconds. Its positive gradient becomes steeper as time increases.
Scroll across the figure to read all labels.
View figure data
| Time (s) | Velocity model |
|---|---|
| 0.000 | -4.000000 |
| 0.125 | -3.984375 |
| 0.250 | -3.937500 |
| 0.375 | -3.859375 |
| 0.500 | -3.750000 |
| 0.625 | -3.609375 |
| 0.750 | -3.437500 |
| 0.875 | -3.234375 |
| 1.000 | -3.000000 |
| 1.125 | -2.734375 |
| 1.250 | -2.437500 |
| 1.375 | -2.109375 |
| 1.500 | -1.750000 |
| 1.625 | -1.359375 |
| 1.750 | -0.937500 |
| 1.875 | -0.484375 |
| 2.000 | 0.000000 |
| 2.125 | 0.515625 |
| 2.250 | 1.062500 |
| 2.375 | 1.640625 |
| 2.500 | 2.250000 |
| 2.625 | 2.890625 |
| 2.750 | 3.562500 |
| 2.875 | 4.265625 |
| 3.000 | 5.000000 |
This is a different motion from the first graph. Its gradient is zero at the initial instant, then positive and grows steeper, so the acceleration becomes positive and increases. Before 2 s the velocity is negative: the positive acceleration opposes the motion and the object slows down. At 2 s the velocity is zero and the object turns round. After 2 s the velocity is positive: the acceleration now acts with the motion and the object speeds up.
A curved displacement–time graph does not, on its own, mean the acceleration changes. The first graph comes from a motion with constant acceleration: the velocity changes steadily, so the s–t graph curves while the v–t graph would be a straight line. A changing velocity–time gradient shows changing acceleration; this may be a curve or straight sections with different gradients.
Guided practice 2
Is the acceleration constant?
Problem
Readings from the velocity–time graph are -4.0, -3.0, 0 and + 5.0 m s⁻¹ at 0, 1.0, 2.0 and 3.0 s. Find the average acceleration in each one-second interval. Could the acceleration have been constant throughout?
Calculate, then compare your working
Hints
Hint 1
compare changes, not readings
How much does velocity change in each one-second interval?
Show solution step by step
Calculate the three averages
Method
Divide each change in velocity by 1.0 s.Reason
Average acceleration is change in velocity per unit time.
Working
Answer
The averages are + 1.0, + 3.0 and + 5.0 m s⁻².Test for constant acceleration
Method
Compare the changes over equal time intervals.Reason
Constant acceleration would change the velocity by equal amounts in equal times.
Working
Answer
The changes are unequal, so the acceleration was not constant from 0 to 3 s. The successive interval averages increased; the sampled readings alone do not reveal every instantaneous value.
Quick check
Common mistakes
- Saying an object speeds up because its gradient “increases”, when the gradient is negative and getting less steep.
- Reading a negative displacement as a negative velocity.
- Using the chord between two far-apart points as the velocity at one instant.
- Calling a curved displacement–time graph “non-uniform acceleration” without checking whether the velocity–time gradient changes.
Spotted an error? Report a correction
Syllabus and review details
- SEC G3 Physics 2027 · 2027
Content Structure, PDF page 9; Subject Content, PDF pages 10–28