Reading Kinematics Graphs
Key idea: Learn to read displacement–time and velocity–time graphs using gradient and area to find velocity, acceleration, and displacement (O Level Physics).
Continue where you stopped
The core idea
On this page
Learning objectives
- State what speed means
- State what velocity means, including its direction
- Calculate average speed from total distance and total time
- Calculate acceleration as change in velocity divided by time taken
- State what uniform acceleration means
- Interpret examples of non-uniform acceleration
- Plot and interpret displacement–time and velocity–time graphs in one dimension
- Deduce rest and uniform or non-uniform velocity from a displacement–time graph
- Deduce rest, uniform velocity and uniform or non-uniform acceleration from a velocity–time graph
- Use signed area under a velocity–time graph to determine displacement
- Recall constant free-fall acceleration near Earth as approximately 10 m/s²
1. Definition
A kinematics graph shows how a motion quantity changes with time (for motion in one dimension).
You should be able to plot and interpret:
- a displacement–time graph
- a velocity–time graph and use the area under a velocity–time graph to find displacement (for uniform velocity or uniform acceleration).
Interactive Concept Check: Kinematics Graph Explorer
Use this explorer to connect all three graph views quickly:
- slope of s-t at a time gives v
- slope of v-t at a time gives a
- signed area under v-t gives displacement
Concept Explorer: Kinematics Graph Relationships
Switch graph-shape presets, move the time marker, and connect slope/area ideas across position-time, velocity-time, and acceleration-time graphs.
- Gradient Interpretation
- Signed Area
- Direction From Velocity
- Graph Translation
Explore the graphs directly in the Kinematics Graph Explorer.
2. Key Ideas
- Always check the axes and units first:
- time, t (s) is on the horizontal axis
- displacement, s (m) or velocity, v (m s⁻¹) is on the vertical axis
- Displacement–time graph (s–t):
- gradient = velocity: v = (Δ s)/(Δ t)
- Velocity–time graph (v–t):
- gradient = acceleration: a = (Δ v)/(Δ t)
- signed area = displacement: Δ s = A_signed
- Units check:
- gradient of s–t is m/s (velocity)
- gradient of v–t is m/s² (acceleration)
- area under v–t is m (displacement)
The figure uses one constant-acceleration example. Other motions produce different shapes, but the gradient and signed-area relationships remain the same.
3. Detailed Explanations
A. Displacement–time graph (s–t)
Use the gradient to tell what the velocity is doing.
| Shape | What it means |
|---|---|
| horizontal line | at rest (velocity = 0) |
| straight line (constant gradient) | uniform velocity |
| curve (changing gradient) | non-uniform velocity (velocity is changing) |
Direction matters:
- positive gradient → positive velocity (moving in the chosen positive direction)
- negative gradient → negative velocity (moving in the opposite direction)
Average velocity between two points:
v = (Δ s)/(Δ t) = (s₂-s₁)/(t₂-t₁)
Reading an s–t graph (schematic)
A schematic displacement–time graph: flat section (rest), positive gradient (positive velocity), then negative gradient (moving back).
Scroll across the graph to read all labels.


View figure data
| Time (s) | s–t |
|---|---|
| 0 | 0 |
| 2 | 0 |
| 5 | 6 |
| 7 | 2 |
For a curve, the gradient changes. At O Level, you are usually asked for the average velocity over a time interval using two points.
B. Velocity–time graph (v–t)
Use the value of v (above/below the axis) to tell direction, and the gradient to tell acceleration.
| Shape | What it means |
|---|---|
| horizontal line at v = 0 | at rest |
| horizontal line above/below 0 | uniform velocity (constant v) |
| straight sloping line | uniform acceleration (constant a) |
| curve | non-uniform acceleration (acceleration is changing) |
Gradient (acceleration):
a = (Δ v)/(Δ t)
Area (displacement):
- area above the time-axis → positive displacement
- area below the time-axis → negative displacement
For full area methods + more practice, see: Area Under a Velocity–Time Graph.
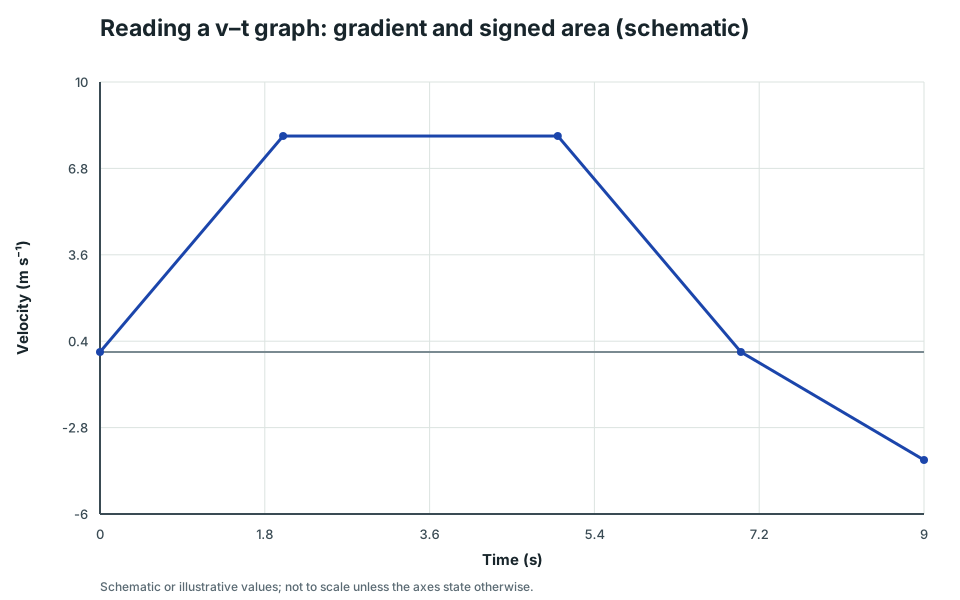
Reading a v–t graph: gradient and signed area (schematic)
A schematic velocity–time graph where the gradient gives acceleration and the area above/below the axis gives positive/negative displacement.
Scroll across the graph to read all labels.
View figure data
| Time (s) | v–t |
|---|---|
| 0 | 0 |
| 2 | 8 |
| 5 | 8 |
| 7 | 0 |
| 9 | -4 |
C. Finding a gradient (draw a large triangle)
When the graph section is a straight line, you can find the gradient reliably using a large gradient triangle.
Exam reminders:
- Pick two well-separated points on the straight line (not necessarily the original plotted points).
- Show your working as:
gradient = Δy/Δxand include the unit. - Use the correct meaning:
- s–t gradient → velocity (m s⁻¹)
- v–t gradient → acceleration (m s⁻²)
D. How to describe motion from a graph (exam workflow)
- Split the graph into time intervals where the shape changes.
- For a displacement–time graph, choose from at rest, uniform velocity or changing velocity.
- For a velocity–time graph, choose from at rest, uniform velocity, uniform acceleration or changing acceleration.
- If asked for a gradient, show Δ y/Δ x with units.
- If asked for an area, split it into simple shapes and add the signed areas.
4. Common Mistakes
A. Mixing up gradient and y-value
- On an s–t graph, the gradient is velocity (not the y-value).
- On a v–t graph, the gradient is acceleration (not the y-value).
B. Ignoring sign (direction)
- A negative gradient on an s–t graph means motion in the negative direction.
- A negative v on a v–t graph means motion in the negative direction.
C. Wrong units
- Gradient of s–t: m/s
- Gradient of v–t: m/s²
- Area under v–t: m
D. Using “distance” when the graph is displacement
- Displacement can decrease; distance travelled cannot.
5. Exam Tips
- Start every question by writing: “gradient = Δ y/Δ x”.
- Use two well-separated points on a straight section (less percentage error).
- Always show the unit at the end (it is an easy mark).
- For curved sections, describe what is happening (velocity/acceleration changing) unless the question specifically asks for an average value over an interval.
- Use the mark-scheme words: “at rest”, “uniform velocity”, “uniform acceleration”, “non-uniform acceleration”.
- For v–t area questions that cross the time-axis, split into above-axis and below-axis sections before combining signed displacement.
6. Worked Examples
Modelled example 1
Reading an s–t graph (rest + velocity)
Problem
A displacement–time graph is horizontal at 5 m from 0–2 s, rises from 5 m to 13 m from 2–6 s, then falls to 9 m from 6–8 s. Identify when the object is at rest and find each interval’s velocity.
Study the worked solution
Identify the horizontal interval
Method
Read zero gradient as zero velocity.Reason
Velocity is the gradient of displacement against time.Working
From 0–2 s, v = 0, so the object is at rest.Find the positive velocity
Method
Calculate the gradient from 2–6 s.Reason
Displacement increases uniformly over this interval.Working
v = (13-5)/(6-2) = 2.0 m s⁻¹Find the negative velocity
Method
Calculate the gradient from 6–8 s.Reason
Falling displacement gives a negative gradient and reverse motion.Working
v = (9-13)/(8-6) = -2.0 m s⁻¹
Guided practice 2
Reading a v–t graph (acceleration)
Problem
Calculate the graph gradient
Hints
Hint 1: use the graph relationship
Hint 2: calculate the changes
View solution step by step
Calculate the gradient
Method
Divide velocity change by time change.Reason
A straight velocity–time line has constant acceleration equal to its gradient.Working
a = (14.0-4.0)/5.0 = 2.0 m s⁻²
Common misconception 3
Displacement vs distance from a v–t graph
Learner response
Velocity is + 4.0 m s⁻¹ from 0–3 s, then -2.0 m s⁻¹ from 3–7 s. A student adds the area magnitudes and claims both displacement and distance are 20 m. Locate the error and find both quantities.
Keep signs for displacement only
View solution step by step
Find the two signed areas
Method
Use rectangles above and below the axis.Reason
Velocity–time area carries the sign of velocity.Working
Δ s₁ = (4.0)(3.0) = 12 m, Δ s₂ = (-2.0)(4.0) = -8.0 mDistinguish displacement and distance
Method
Combine signed areas for displacement and magnitudes for distance.Reason
Displacement retains direction; distance accumulates path length.Working
Δ s = 12-8 = 4.0 m, d = 12 + 8 = 20 m
Examiner practice 4
Displacement from a v–t triangle (area)
Examination question
Name the graph quantity and show the area
View solution step by step
Identify signed area as displacement
1 markMethod
Use the area under the velocity–time line.Reason
Velocity multiplied by time has units of displacement.Working
Δ s = Aᵥ₋ₜUse the triangle area
1 markMethod
Apply half base times height.Reason
The uniform rise from zero encloses a triangle.Working
Δ s = (1/2)(6.0)(12)State the displacement
1 markReason
The whole triangle lies above the time axis.Working
Δ s = 36 m
Self-mark with the mark scheme
Compare your response with each mark point. Select a point only when your response contains that evidence.
Self-mark the graph relationship, triangle method and final displacement separately.
Challenge 5
Direction change from a v–t graph
Direction-change transfer
Combine gradient with the zero crossing
Hints
Hint 1: find the sloping gradient
Hint 2: locate the zero crossing
View solution step by step
Find the acceleration
Method
Calculate the velocity–time gradient.Reason
The line is straight from 4–8 s, so acceleration is uniform.Working
a = (-2.0-6.0)/(8.0-4.0) = -2.0 m s⁻²Find the time to reach zero velocity
Method
Use the uniform rate of velocity decrease.Reason
The object changes direction where the line crosses v = 0.Working
Δ t = (0-6.0)/(-2.0) = 3.0 s, t = 4.0 + 3.0 = 7.0 s
7. Mind Stretchers
Mind stretcher 1: Distance vs displacement on a graphExtension
A graph of “distance travelled” against time slopes downwards in one section.
Is this possible? What is the graph more likely showing?
Show Answer
No. Distance travelled cannot decrease (it is the total path length).
If the graph goes down, it is more likely a displacement–time (position–time) graph, because displacement can decrease when the object moves in the opposite direction.
Mind stretcher 2: What does a steeper s–t curve mean?Extension
On a displacement–time graph, the curve becomes steeper as time increases (the gradient increases).
What does this tell you about the velocity?
Show Answer
The gradient of an s–t graph is velocity. If the gradient increases, the velocity is increasing.
So the object is speeding up in the positive direction.
Mind stretcher 3: Can acceleration be zero when velocity is not zero?Extension
On a v–t graph, the line is horizontal at v = +5.0 m s⁻¹.
Is the acceleration zero? Is the object moving?
Show Answer
Yes, acceleration is zero because the gradient is zero.
The object is still moving because its velocity is + 5.0 m s⁻¹ (not zero).
Mind stretcher 4: Describe the motion (quick practice)Extension
For each description, state what the object is doing using mark-scheme words like at rest, uniform velocity, uniform acceleration, speeding up, slowing down, or changes direction.
- s–t graph is a horizontal line.
- s–t graph is a straight line with a constant positive gradient.
- s–t graph is a curve that gets steeper with time.
- v–t graph is a horizontal line above the time-axis.
- v–t graph is a straight line sloping upwards and stays above the time-axis.
- v–t graph is a straight line sloping downwards but stays above the time-axis.
- v–t graph is a straight line that crosses the time-axis from positive to negative v.
- v–t graph is a horizontal line on the time-axis (v = 0).
Show Answers
- At rest (velocity = 0).
- Uniform velocity in the positive direction.
- Velocity is increasing (speeding up) in the positive direction (gradient increasing).
- Uniform velocity (constant v) in the positive direction.
- Uniform acceleration (constant positive acceleration): the object is speeding up in the positive direction.
- Uniform negative acceleration: the object is slowing down while still moving in the positive direction.
- Uniform negative acceleration with a direction change: the object slows to v = 0, then moves in the negative direction (velocity changes sign).
- At rest (velocity = 0).
Continue with the next resource in this course.
Course and syllabus information
- Course
- SEC G3 Physics
- Edition
- SEC G3 Physics 2027