Cooling Curve (Temperature–Time Graph)
Key idea: Learn how to sketch and interpret a cooling curve and explain flat sections using latent heat for O Level Physics.
Continue where you stopped
The core idea
On this page
Learning objectives
- Compare physical properties of solids, liquids and gases
- Explain state properties using particle arrangement, motion, forces and separation
- Infer random molecular motion from a Brownian-motion experiment
- Relate temperature rise to increased average kinetic energy of particles
- Explain gas pressure using particle collisions with container walls
- Explain heating from higher to lower temperature until thermal equilibrium
- Describe conduction in solids through particle vibration and mobile electrons
- Describe convection in fluids through density changes and bulk motion
- Explain that energy transfer by electromagnetic radiation needs no material medium
- Explain how surface colour, texture, temperature and area affect radiation transfer rate
- Apply conduction, convection and radiation in everyday systems
- describe internal energy as an energy store that is made up of the total kinetic energy associated with the random motion of the particles and the total potential energy between the particles in the system
- Define heat capacity and specific heat capacity
- Apply energy transferred = mass × specific heat capacity × temperature change
- describe melting/solidification and boiling/condensation as processes of energy transfer without a change in temperature
- Explain the difference between boiling and evaporation
- Define latent heat and specific latent heat
- Apply energy transferred for a change of state = mass × specific latent heat
- Explain latent heat using particle behaviour
- Sketch and interpret a cooling curve
1. Definition
A. Cooling curve
A cooling curve is a graph of temperature against time as a substance cools.
For a pure substance, flat sections mean a change of state at constant temperature (latent heat).
2. Key Ideas
- For a pure substance, the temperature:
- falls while it cools in a single state (solid / liquid / gas)
- stays constant during a change of state (because of latent heat)
- Sloping section: temperature changes → average kinetic energy of particles changes.
- Flat section (plateau): temperature constant → energy transfer changes the particles’ arrangement and potential energy.
- The temperature of a plateau gives the boiling point (condensation) or melting point (freezing) for a pure substance.
3. Detailed Explanations
A. Typical cooling curve (shape only)
You should be able to sketch and interpret a cooling curve, including its constant-temperature changes of state.
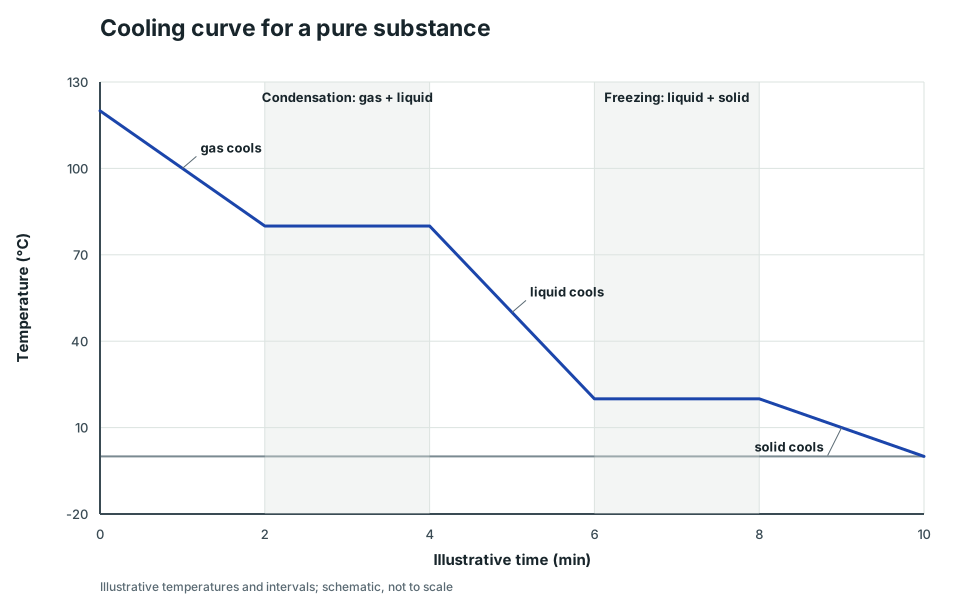
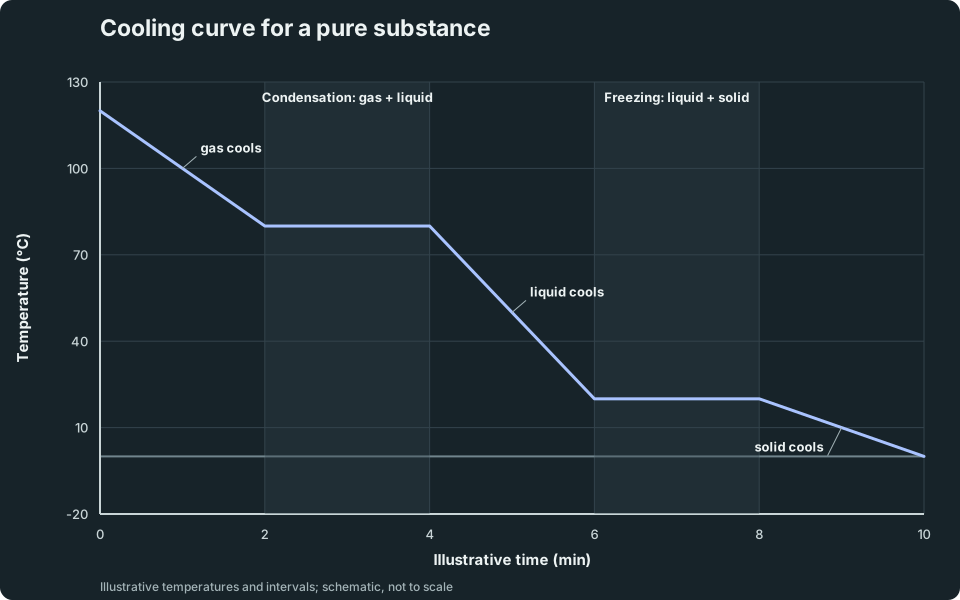
Cooling curve for a pure substance
Schematic temperature–time graph falling from gas to solid. A plateau at 80 degrees Celsius marks condensation and a plateau at 20 degrees Celsius marks freezing. The temperatures and time intervals are illustrative and not to scale.
View figure data
| Illustrative time (min) | Temperature |
|---|---|
| 0 | 120 |
| 2 | 80 |
| 4 | 80 |
| 6 | 20 |
| 8 | 20 |
| 10 | 0 |
B. How to interpret each part of a cooling curve
When the substance is cooling:
- Gas cooling (slope down): particles lose kinetic energy → temperature falls.
- Condensation (flat): gas changes to liquid at constant temperature → latent heat is released.
- Liquid cooling (slope down): temperature falls as kinetic energy decreases.
- Freezing/solidification (flat): liquid changes to solid at constant temperature → latent heat of fusion is released.
- Solid cooling (slope down): temperature falls further.
C. Why is the temperature constant during the flat sections?
During a change of state, energy transfer does not change the average kinetic energy of the particles, so the temperature stays constant. Instead, it changes the particles’ arrangement and potential energy as attractive forces are overcome or re-form.
This links directly to:
4. Common Mistakes
- Thinking the temperature keeps changing during a change of state (for a pure substance, it stays constant).
- Mixing up freezing (liquid → solid) with condensation (gas → liquid).
5. Exam Tips
- Always label axes: temperature on the y-axis, time on the x-axis.
- Plateaus happen at fixed temperatures for a pure substance (melting point / boiling point).
- Use the curve to state what state(s) are present at a given time interval (e.g. “liquid + solid during freezing”).
6. Worked Examples
Modelled example 1
Reading a cooling curve
Problem
Study the worked solution
Use the graph shape
Method
Identify the flat section as a constant-temperature change of state.Reason
Energy leaves while particle potential energy changes rather than average kinetic energy.Working
Plateau → state change at 78°C.Use the cooling direction and initial state
Method
Identify condensation from gas to liquid.Reason
A gas cooling through its gas–liquid transition condenses.Working
78°C is the boiling/condensation temperature at the stated pressure.
Guided practice 2
States present during a plateau
Problem
Combine direction with the plateau
Hints
Hint 1: follow the cooling direction
Hint 2: use coexistence
View solution step by step
Identify the change
Method
State freezing or solidification.Reason
The substance begins as liquid and is cooling at a fixed temperature.Working
Liquid → solid.State the phases
Method
State that liquid and solid coexist.Reason
Only part of the sample has solidified before the plateau ends.Working
States: liquid + solid.
Common misconception 3
Pure vs impure substance
Learner response
Use the pure-substance benchmark
View solution step by step
Recall the pure-substance pattern
Method
Expect a fixed-temperature plateau during freezing.Reason
A pure substance changes state at one freezing point at fixed pressure.Working
Pure sample: horizontal freezing section.Interpret the observed range
Method
Suggest that the sample is a mixture or contains impurities.Reason
Such a sample can solidify over a range of temperatures.Working
Sloping freezing region → possible impurity/mixture.
Examiner practice 4
Identify the stages
Examination question
Label each graph section in sequence
View solution step by step
Label the first slope
1 markMethod
State that gas cools.Reason
The temperature falls in one state before the upper transition.Working
120°C to 78°C: gas cooling.Label the plateau
1 markMethod
State condensation from gas to liquid.Reason
The flat section is a constant-temperature state change during cooling.Working
At 78°C: condensation.Label the final slope
1 markMethod
State that liquid cools.Reason
The gas has fully condensed by the end of the plateau.Working
78°C to 10°C: liquid cooling.
Self-mark with the mark scheme
Compare your response with each mark point. Select a point only when your response contains that evidence.
Self-mark the three sections separately.
Challenge 5
Sketching from data
Data-to-graph transfer
Translate transition temperatures into graph segments
Hints
Hint 1: place the two plateaux
Hint 2: connect single-state regions
View solution step by step
Build the gas-to-liquid region
Method
Draw gas cooling to 60°C, then a condensation plateau.Reason
The boiling point is also the condensation temperature for the pure substance.Working
Downward gas slope → flat at 60°C.Build the liquid-to-solid region
Method
Draw liquid cooling to -20°C, a freezing plateau, then solid cooling.Reason
The freezing point sets the second constant-temperature transition.Working
Liquid slope → flat at -20°C → solid slope.
7. Mind Stretchers
Mind stretcher 1: “Two states at once”Extension
During the flat section for freezing, what states are present, and where does the energy go?
Show Answer
Both liquid and solid are present. Energy is transferred out as latent heat of fusion, which decreases the potential energy between particles as they form a solid lattice. The temperature stays constant.
Mind stretcher 2: Why a plateau might not be perfectly flatExtension
In a real cooling curve experiment, the “flat” section can slope slightly. Suggest two reasons.
Show Answer
Possible reasons include:
- the substance is not perfectly pure, so the change of state happens over a small temperature range,
- the sample has temperature gradients or the thermometer has not reached thermal equilibrium with the part being measured.
8. Practice and next step
Sketch a cooling curve from a blank set of axes, label every state and plateau, and explain where kinetic and potential energy change. Then complete the structured Thermal Physics questions and return to the Thermal Physics hub for the full checklist.
Continue with the next resource in this course.
Course and syllabus information
- Course
- SEC G3 Physics
- Edition
- SEC G3 Physics 2027