General wave properties
Wave motion, wave quantities, v = fλ, transverse and longitudinal waves, sound, echoes and ultrasound for G3 Pure and O-Level Physics.
Offline pages
Saved on this device only. Connect at least once every 30 days to confirm Premium. Sign-out or a change of account removes saved copies.
Before you begin
A wave carries energy from place to place without carrying the material along with it. The lessons first build that idea with ropes, springs and ripples, define the wave quantities and the equation v = fλ, then use them for sound: how it is made, what sets its loudness and pitch, and how echoes and ultrasound measure distances.
Be comfortable with: speed, distance and time from kinematics, because wave speed and echo timing use them.
Learning goals
- Describe wave generation by vibrating sources, ropes and springs
- Describe ripple-tank waves using wavefronts
- Explain that waves transfer energy
- Explain that wave energy transfer does not transfer matter
- Use amplitude, frequency and wavelength to describe wave motion
- Define and use wave speed and period and interpret wave graphs
- Recall and apply wave speed = frequency × wavelength
- Compare transverse and longitudinal waves and give examples
- Explain sound production by vibration and the need for a medium
- Describe sound using compressions and rarefactions
- Relate sound loudness to amplitude and pitch to frequency
- Explain reflected-sound echoes and use them to measure distance
- Explain ultrasound use in sonar and soft-tissue scanning
Syllabus statements covered
- describe what is meant by wave motion as illustrated by vibrations in ropes and springs and by waves in a ripple tank (including use of the term wavefront)
- show an understanding that waves transfer energy without transferring matter
- define and use the terms speed, frequency, wavelength, period and amplitude, including graphical representation
- recall and apply the relationship speed of wave = frequency × wavelength to new situations or to solve related problems
- compare transverse and longitudinal waves and give suitable examples of each
- show an understanding that sound can be produced by vibrating sources and a medium is required for the transmission of sound.
- describe the longitudinal nature of sound waves in terms of the processes of compression and rarefaction
- relate loudness of a sound wave to its amplitude and pitch to its frequency
- describe how the reflection of sound may produce an echo, and how this may be used for measuring distances
- describe and explain how ultrasound is used, e.g. including sonar and medical scanning of soft tissue.
Lessons
Work through them in order.
Wave motion
- What is a wave?Explain how waves carry energy without carrying matter, and tell transverse from longitudinal waves.
- Wave quantities, graphs and speedRead amplitude, wavelength and period from graphs, and use frequency and wavelength to calculate wave speed.
- Ripple tankUse a ripple tank to show wavefronts and measure the wavelength, frequency and speed of water waves.
Sound
- Production and propagation of soundExplain how a vibrating source makes sound and why sound travels as a longitudinal wave through a medium.
- Sound speed and wavelengthCompare the speed of sound in different media and use v = fλ to find a wavelength or frequency.
- Loudness and pitchRelate loudness to amplitude and pitch to frequency, and predict what happens to the wavelength.
- Echoes and measuring sound speedMeasure the speed of sound and solve echo problems, remembering that the sound travels there and back.
- UltrasoundExplain how ultrasound pulses and their echoes are used to find distances and build images.
Practise and check
Or choose
Topic reference
Quick reference
| Quantity or idea | Symbol, equation or rule | Unit |
|---|---|---|
| amplitude | A: maximum displacement from the rest position | m |
| wavelength | λ: distance between neighbouring crests or compressions | m |
| frequency | f: number of waves produced each second | Hz |
| period | T = 1/f: time for one wave | s |
| wave speed | v = fλ | m s⁻¹ |
| echo distance | d = vt/2, because the sound goes there and back | m |
| speed of sound | about 340 m s⁻¹ in air, 1500 m s⁻¹ in water | m s⁻¹ |
Compare pressure amplitude and frequency
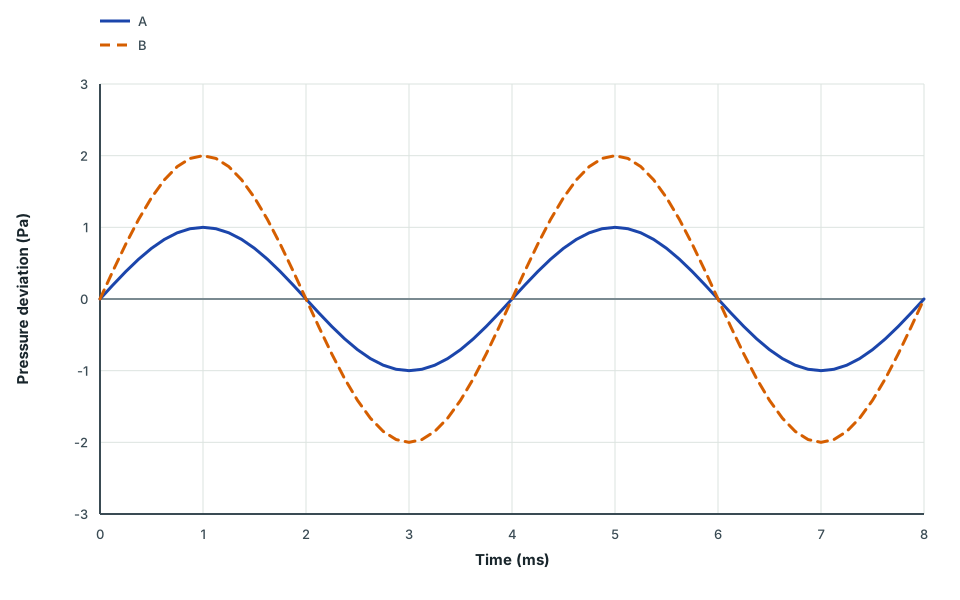
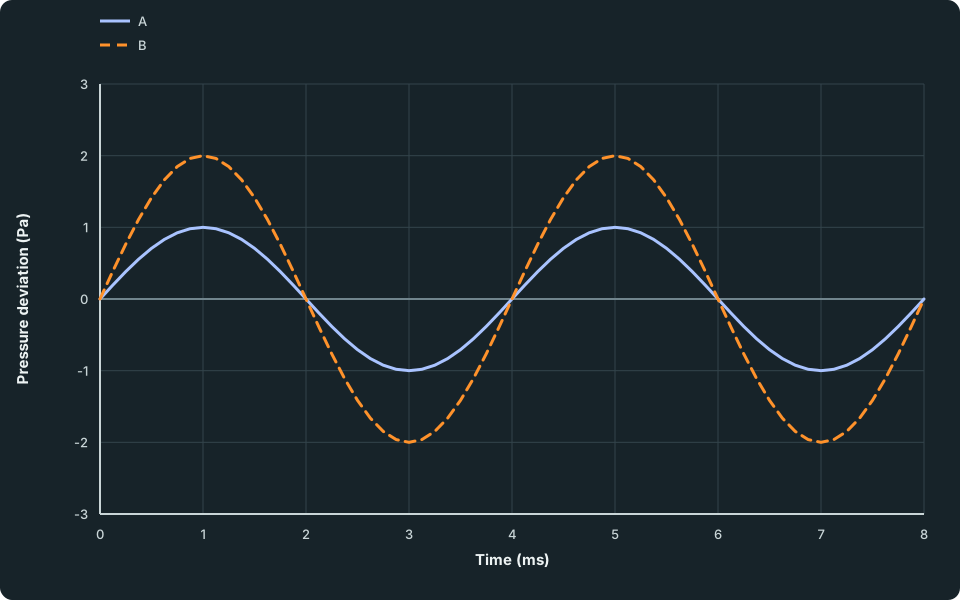
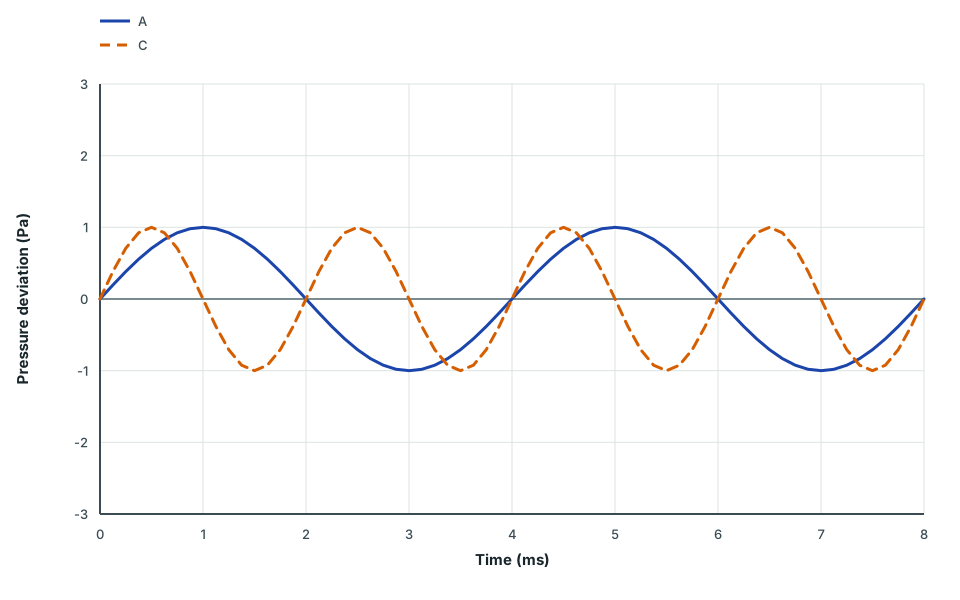
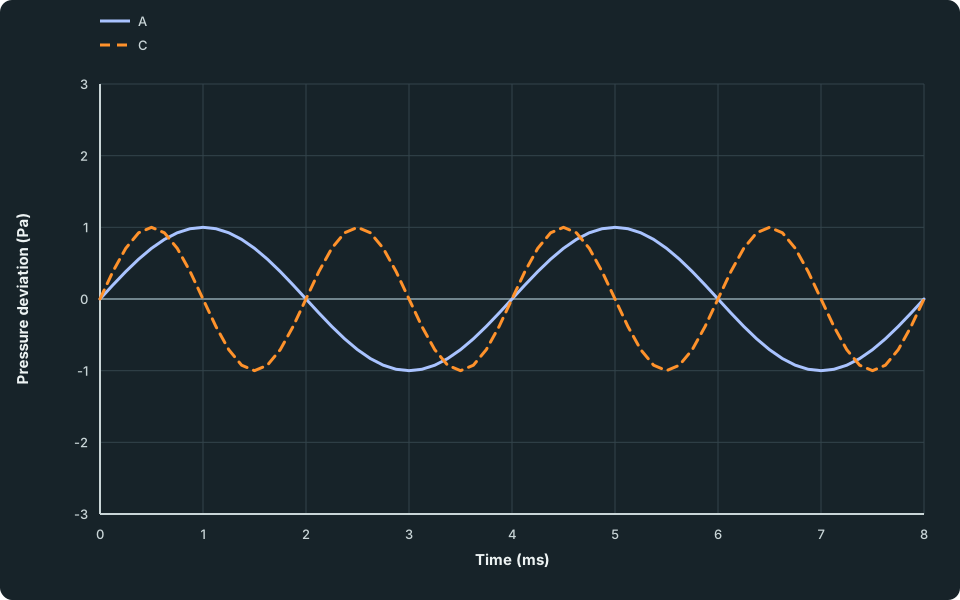
Two constructed pressure–time comparisons use common axis scales: A and B differ in amplitude at fixed frequency; A and C differ in frequency at equal pressure amplitude. These are graphs of local pressure changes, not the physical shape of sound moving through air.
Sound records A and B
Pressure change in Pa against time in ms, from 0 ms to 8 ms, for two constructed sound models at a common listening position. Record A varies between +1 Pa and −1 Pa; record B varies between +2 Pa and −2 Pa. Both have maxima at 1 ms and 5 ms, so each completes two cycles in 8 ms.
Scroll across the figure to read all labels.
View figure data
| Time (ms) | A | B |
|---|---|---|
| 0.000 | 0.000000 | 0.000000 |
| 0.125 | 0.195090 | 0.390181 |
| 0.250 | 0.382683 | 0.765367 |
| 0.375 | 0.555570 | 1.111140 |
| 0.500 | 0.707107 | 1.414214 |
| 0.625 | 0.831470 | 1.662939 |
| 0.750 | 0.923880 | 1.847759 |
| 0.875 | 0.980785 | 1.961571 |
| 1.000 | 1.000000 | 2.000000 |
| 1.125 | 0.980785 | 1.961571 |
| 1.250 | 0.923880 | 1.847759 |
| 1.375 | 0.831470 | 1.662939 |
| 1.500 | 0.707107 | 1.414214 |
| 1.625 | 0.555570 | 1.111140 |
| 1.750 | 0.382683 | 0.765367 |
| 1.875 | 0.195090 | 0.390181 |
| 2.000 | 0.000000 | 0.000000 |
| 2.125 | -0.195090 | -0.390181 |
| 2.250 | -0.382683 | -0.765367 |
| 2.375 | -0.555570 | -1.111140 |
| 2.500 | -0.707107 | -1.414214 |
| 2.625 | -0.831470 | -1.662939 |
| 2.750 | -0.923880 | -1.847759 |
| 2.875 | -0.980785 | -1.961571 |
| 3.000 | -1.000000 | -2.000000 |
| 3.125 | -0.980785 | -1.961571 |
| 3.250 | -0.923880 | -1.847759 |
| 3.375 | -0.831470 | -1.662939 |
| 3.500 | -0.707107 | -1.414214 |
| 3.625 | -0.555570 | -1.111140 |
| 3.750 | -0.382683 | -0.765367 |
| 3.875 | -0.195090 | -0.390181 |
| 4.000 | 0.000000 | 0.000000 |
| 4.125 | 0.195090 | 0.390181 |
| 4.250 | 0.382683 | 0.765367 |
| 4.375 | 0.555570 | 1.111140 |
| 4.500 | 0.707107 | 1.414214 |
| 4.625 | 0.831470 | 1.662939 |
| 4.750 | 0.923880 | 1.847759 |
| 4.875 | 0.980785 | 1.961571 |
| 5.000 | 1.000000 | 2.000000 |
| 5.125 | 0.980785 | 1.961571 |
| 5.250 | 0.923880 | 1.847759 |
| 5.375 | 0.831470 | 1.662939 |
| 5.500 | 0.707107 | 1.414214 |
| 5.625 | 0.555570 | 1.111140 |
| 5.750 | 0.382683 | 0.765367 |
| 5.875 | 0.195090 | 0.390181 |
| 6.000 | 0.000000 | 0.000000 |
| 6.125 | -0.195090 | -0.390181 |
| 6.250 | -0.382683 | -0.765367 |
| 6.375 | -0.555570 | -1.111140 |
| 6.500 | -0.707107 | -1.414214 |
| 6.625 | -0.831470 | -1.662939 |
| 6.750 | -0.923880 | -1.847759 |
| 6.875 | -0.980785 | -1.961571 |
| 7.000 | -1.000000 | -2.000000 |
| 7.125 | -0.980785 | -1.961571 |
| 7.250 | -0.923880 | -1.847759 |
| 7.375 | -0.831470 | -1.662939 |
| 7.500 | -0.707107 | -1.414214 |
| 7.625 | -0.555570 | -1.111140 |
| 7.750 | -0.382683 | -0.765367 |
| 7.875 | -0.195090 | -0.390181 |
| 8.000 | 0.000000 | 0.000000 |
Sound records A and C
Pressure change in Pa against time in ms, from 0 ms to 8 ms, for two constructed sound models at a common listening position. Both records vary between +1 Pa and −1 Pa. Record A has maxima at 1 ms and 5 ms and completes two cycles in 8 ms; record C has maxima at 0.5, 2.5, 4.5 and 6.5 ms and completes four cycles in 8 ms.
Scroll across the figure to read all labels.
View figure data
| Time (ms) | A | C |
|---|---|---|
| 0.000 | 0.000000 | 0.000000 |
| 0.125 | 0.195090 | 0.382683 |
| 0.250 | 0.382683 | 0.707107 |
| 0.375 | 0.555570 | 0.923880 |
| 0.500 | 0.707107 | 1.000000 |
| 0.625 | 0.831470 | 0.923880 |
| 0.750 | 0.923880 | 0.707107 |
| 0.875 | 0.980785 | 0.382683 |
| 1.000 | 1.000000 | 0.000000 |
| 1.125 | 0.980785 | -0.382683 |
| 1.250 | 0.923880 | -0.707107 |
| 1.375 | 0.831470 | -0.923880 |
| 1.500 | 0.707107 | -1.000000 |
| 1.625 | 0.555570 | -0.923880 |
| 1.750 | 0.382683 | -0.707107 |
| 1.875 | 0.195090 | -0.382683 |
| 2.000 | 0.000000 | 0.000000 |
| 2.125 | -0.195090 | 0.382683 |
| 2.250 | -0.382683 | 0.707107 |
| 2.375 | -0.555570 | 0.923880 |
| 2.500 | -0.707107 | 1.000000 |
| 2.625 | -0.831470 | 0.923880 |
| 2.750 | -0.923880 | 0.707107 |
| 2.875 | -0.980785 | 0.382683 |
| 3.000 | -1.000000 | 0.000000 |
| 3.125 | -0.980785 | -0.382683 |
| 3.250 | -0.923880 | -0.707107 |
| 3.375 | -0.831470 | -0.923880 |
| 3.500 | -0.707107 | -1.000000 |
| 3.625 | -0.555570 | -0.923880 |
| 3.750 | -0.382683 | -0.707107 |
| 3.875 | -0.195090 | -0.382683 |
| 4.000 | 0.000000 | 0.000000 |
| 4.125 | 0.195090 | 0.382683 |
| 4.250 | 0.382683 | 0.707107 |
| 4.375 | 0.555570 | 0.923880 |
| 4.500 | 0.707107 | 1.000000 |
| 4.625 | 0.831470 | 0.923880 |
| 4.750 | 0.923880 | 0.707107 |
| 4.875 | 0.980785 | 0.382683 |
| 5.000 | 1.000000 | 0.000000 |
| 5.125 | 0.980785 | -0.382683 |
| 5.250 | 0.923880 | -0.707107 |
| 5.375 | 0.831470 | -0.923880 |
| 5.500 | 0.707107 | -1.000000 |
| 5.625 | 0.555570 | -0.923880 |
| 5.750 | 0.382683 | -0.707107 |
| 5.875 | 0.195090 | -0.382683 |
| 6.000 | 0.000000 | 0.000000 |
| 6.125 | -0.195090 | 0.382683 |
| 6.250 | -0.382683 | 0.707107 |
| 6.375 | -0.555570 | 0.923880 |
| 6.500 | -0.707107 | 1.000000 |
| 6.625 | -0.831470 | 0.923880 |
| 6.750 | -0.923880 | 0.707107 |
| 6.875 | -0.980785 | 0.382683 |
| 7.000 | -1.000000 | 0.000000 |
| 7.125 | -0.980785 | -0.382683 |
| 7.250 | -0.923880 | -0.707107 |
| 7.375 | -0.831470 | -0.923880 |
| 7.500 | -0.707107 | -1.000000 |
| 7.625 | -0.555570 | -0.923880 |
| 7.750 | -0.382683 | -0.707107 |
| 7.875 | -0.195090 | -0.382683 |
| 8.000 | 0.000000 | 0.000000 |
A and B have the same frequency: compare their pressure amplitudes. A and C have equal pressure amplitudes: compare their frequencies for pitch. Equal pressure amplitudes at different frequencies need not sound equally loud to a real listener.
Core knowledge to remember
- Waves transfer energy without transferring matter. The particles of the medium vibrate about fixed positions.
- A wavefront is a line joining points at the same stage of vibration. The wave travels at right angles to its wavefronts.
- In a transverse wave the vibrations are perpendicular to the direction of travel (light, waves on a rope). In a longitudinal wave they are parallel to it (sound).
- Sound is produced by vibrating sources and needs a medium; it cannot travel through a vacuum.
- Sound travels as compressions (higher pressure) and rarefactions (lower pressure).
- Loudness depends on amplitude; pitch depends on frequency.
- An echo is reflected sound. Ultrasound is sound above about 20 000 Hz, used in sonar and in medical scanning of soft tissue.
Common mistakes
- Measuring amplitude from crest to trough, or wavelength from crest to trough.
- Reading a period from a displacement–distance graph, or a wavelength from a displacement–time graph.
- Forgetting to convert cm to m or kHz to Hz before using v = fλ.
- Forgetting the factor of 2 when finding a distance from an echo time.
- Saying the air in a sound wave travels with the wave, or vibrates up and down.
- Saying a louder sound has a higher pitch. Volume changes amplitude, not frequency.
- Calling ultrasound an electromagnetic wave. It is sound.