Table of Contents
Wave
Wave is defined as the propagation of periodic disturbances from one region to another, without the transfer of any material medium.
- Source of a wave: vibration or oscillation
- There is a transfer of energy from one point to another without the transfer of any material between the two points.
- Can be classified into two types (more types below): transverse waves and longitudinal waves
Waves provide a mechanism for the transfer of energy from one point to another, there is no transfer of any material between the points.
Classifications Of Waves
Waves can be classified as:
- Mechanical OR Electromagnetic
- Transverse OR Longitudinal
- Progressive(travelling) OR Stationary (standing)
Mechanical
- Require a medium for propagation
- Particles of medium oscillate but do not propagate
Electromagnetic
- Require no medium for propagation(can travel through vacuum)
- Wave motion is in the form of oscillating electric and magnetic fields
Transverse
- Particles oscillate perpendicular to the direction of the waves
- Does not require a medium for propagation
Longitudinal
- Particles oscillate parallel to the direction of propagation of the wave
- Requires a medium for propagation
Progressive (Travelling)
- Energy of wave is transferred from one point to another
- Profile of wave appears to be moving although the particles in the medium do not get transported along with the wave
Stationary (Standing)
- Energy of the wave is not transferred from one point to another
- The profile of the wave does not appear to be moving
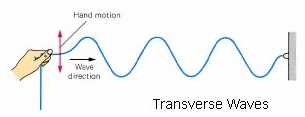
Transverse Waves
Transverse wave is a wave in which direction of vibration is perpendicular to the direction of movement of wave.
A transverse wave can be propagated along a rope (or a spring) by securing one end and rapidly oscillating the other end up and down. The disturbance initiated by the hand is transmitted from one segment of the rope to the next, where each segment replicates the motion with a slight delay. The peaks and troughs of the wave traverse the length of the rope as each segment vibrates transversely around its original position.
Examples are : water waves, waves on a string and electromagnetic waves (Radio waves, light waves).
Characteristics Of Transverse Waves
- The particles oscillate perpendicularly (up and down) to the direction of travel.
- Peak: Highest point reached by the particle from its neutral position
- Trough: Lowest point reached by the particle from its neutral position
- The distance between adjacent particles remains constant, in the direction of the propagation of the wave.
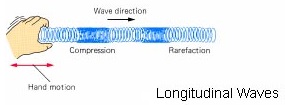
Longitudinal Waves
Longitudinal wave is a wave in which the direction of vibration is parallel to the direction of travel of the wave
Examples are: sound waves and waves on a slinky spring.(which consists of regions of rarefaction and compression).
Characteristics Of Longitudinal Waves
- The particles oscillate along (to-and-fro) the direction of travel.
- Compression: Section in which the particles are closest together (High pressure)
- Rarefaction: Section in which the particles are furthest apart (Low pressure)
- The distance between adjacent particles varies from a maximum value (furthest apart) to a minimum value (closest together), in the direction of the propagation of the wave.
For a longitudinal wave at an instant of time,
- displacement is zero when the particle is at equilibrium position
- displacement is positive when the particle is displaced to the right of its equilibrium position
- displacement is negative when the particle is displaced to the left of its equilibrium position
Table Showing Differences Between Transverse Wave & Longitudinal Wave
| Feature | Transverse Wave | Longitudinal Wave |
|---|---|---|
| Definition | A wave in which the motion of the medium’s particles is perpendicular to the direction of the wave’s travel. | A wave in which the motion of the medium’s particles is parallel to the direction of the wave’s travel. |
| Examples | Water waves, electromagnetic waves (light, microwaves, X-rays) | Sound waves in air, compression waves in springs |
| Medium | Can travel through solids and vacuum (electromagnetic waves) | Requires a material medium (cannot travel through vacuum) |
| Wavefront | Perpendicular to the direction of energy transfer | Parallel to the direction of energy transfer |
| Propagation Speed | Depends on the medium and wave type (light travels fastest in a vacuum) | Generally slower than transverse waves; depends on the density and elasticity of the medium |
| Particle Motion | Perpendicular to the wave direction | Parallel to the wave direction |
| Polarization | Can be polarized (oscillation can be limited to a single plane) | Cannot be polarized (particles move along the wave’s direction) |
Sound Represented On A Pressure-Distance Graph
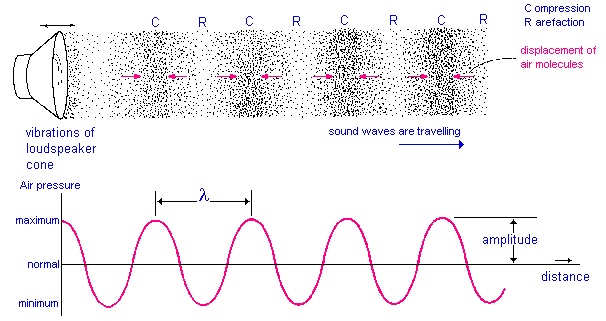
Sound waves are mechanical waves that propagate through a medium, such as air, by causing fluctuations in the pressure of the medium. These fluctuations can be effectively represented and analyzed using a pressure-distance graph, which plots the variations in air pressure against the distance from the source of the sound.
On such a graph, the air pressure is observed to be highest at points known as compressions, where the molecules of the medium are closest together. Conversely, the pressure is lowest at points called rarefactions, where the molecules are spread further apart. This alternating pattern of high and low pressure regions creates a visual representation of the sound wave’s propagation through the medium.
Key Features of the Pressure-Distance Graph
- Compressions: Represented by peaks on the graph, compressions indicate regions of high pressure where air molecules are densely packed. These areas correspond to the parts of the sound wave where the energy is momentarily concentrated.
- Rarefactions: Shown as troughs, rarefactions depict regions of low pressure with air molecules more sparsely distributed. These areas provide a visual cue to the parts of the wave where the medium’s particles are momentarily spread apart.
- Wavelength: The distance between two consecutive compressions or two consecutive rarefactions on the graph. This measurement is crucial for determining the frequency and, consequently, the pitch of the sound.
- Amplitude: The height of the peaks (compressions) from the equilibrium position, or the depth of the troughs (rarefactions), indicates the sound wave’s amplitude. Higher amplitude corresponds to louder sounds, as it represents greater fluctuations in air pressure.
Implications & Applications Of Pressure-Distance Graph
Understanding the representation of sound on a pressure-distance graph has practical implications in various fields such as acoustics, audio engineering, and even in medical diagnostics where ultrasound technology is employed. By analyzing these graphs, scientists and engineers can infer properties of the sound wave, such as its intensity, pitch, and speed of propagation. Additionally, this visual representation helps in the design of better acoustic materials and technologies, from concert halls to noise-cancelling headphones.
In summary, the pressure-distance graph serves as a powerful tool for visualizing and understanding the dynamic nature of sound waves. By examining the patterns of compressions and rarefactions, we can gain insights into the fundamental properties of sound and its interaction with various mediums.
Wavefront
A wavefront is an imaginary line or surface that joined all adjacent points which have the same phase of vibration on the wave.
Any two points on a wave are said to be in phase when they have completed identical fractions of their periodic motion.
A oscillating source generates a series of uniform wavefronts. When using a ripple tank, a vibrating bar (resembling a line source) produces straight wavefronts, while a vibrating ball (similar to a point source) produces circular wavefronts. A line drawn perpendicular to a wavefront, indicating its travel direction, is referred to as a “ray.”
Note: Even though the diagram above shows the wavefronts for all the crests, wavefront does not have to be at the crests!
Video On Transverse & Longitudinal Waves
Properties Of Waves
Displacement-Distance Graph Of A Wave
The terminology associated with waves can be clarified using a displacement–distance graph (refer to figure above). This graph illustrates, at a specific moment in time, the sideways displacement from their original positions of the segments within the medium vibrating at various distances from the wave’s origin.
Amplitude
Amplitude is the maximum displacement from the rest or central position, in either directions.
- SI unit is metre
- Scalar quantity
Frequency
Frequency (f) is defined as the number of complete waves produced per unit time.
- SI unit is hertz (Hz) – 1 Hz = 1 complete cycle per second
- Scalar quantity
- Determined by the source (for water waves)
Wavelength
Wavelength (λ) is the distance between corresponding points of two consecutive waves.
- SI unit is metre
- Scalar quantity
Speed
Speed of the wave propagation is defined as the distance travelled by a wave per unit time.
- SI unit is metre per second (m s-1)
- Scalar quantity
Period
Period (T) is defined as the time taken to produce one complete wave.
- SI unit is second (s)
- Scalar quantity
The period of a wave is given by:
$$T = \frac{1}{f}$$
Velocity
Velocity is the distance travelled by a wave in one second.
- SI unit is metres per second (m s-1)
- Vector quantity
- $v = f \lambda$ (Important!)
The velocity of a wave is given by:
$$v = f \lambda$$
Worked Examples
Example 1
Given a wave speed of 4 cm/s and a frequency of 2 Hz, determine the wavelength of the wave.
Click here to show/hide answer
To find the wavelength $\lambda$ of the wave, you can use the wave equation:
$$\text{Wave Speed (v)} = \text{Frequency (f)} \times \text{Wavelength (λ)}$$
Given:
$$\text{Wave Speed (v)} = 4 \ \text{cm/s}$$
$$\text{Frequency (f)} = 2 \ \text{Hz}$$
Substitute the values into the equation and solve for the wavelength $λ$:
$$\begin{aligned} 4 \ \text{cm/s} &= 2 \ \text{Hz} \times \text{Wavelength (λ)} \\ \text{Wavelength (λ)} &= \frac{4 \ \text{cm/s}}{2 \ \text{Hz}} \\ \text{Wavelength (λ)} &= 2 \ \text{cm} \end{aligned}$$
Therefore, the wavelength of the wave is 2 cm.
Example 2: Identifying Wave Characteristics
A pressure-distance graph of a sound wave shows consecutive compressions 0.34 meters apart and the amplitude of the wave is 0.02 Pascal. What is the wavelength of the sound wave, and what does the amplitude indicate about the sound?
Click here to show/hide answer
The distance between two consecutive compressions on a pressure-distance graph represents the wavelength of the sound wave. Therefore, the wavelength of the sound wave is 0.34 meters. The amplitude of the wave, given as 0.02 Pascal, indicates the maximum deviation of the pressure from its equilibrium value. A higher amplitude means a louder sound. In this case, the amplitude of 0.02 Pascal suggests a certain level of loudness, with the exact perception depending on the sensitivity of the listener’s ear and the ambient noise level.
Example 3: Calculating Sound Properties
If the pressure-distance graph for a sound wave shows that the distance between a compression and the next rarefaction is 0.17 meters, what is the wavelength of the sound? Additionally, if this sound wave is traveling in air at room temperature (approximately 343 meters per second), what is its frequency?
Click here to show/hide answer
Since the distance from a compression to the next rarefaction represents half a wavelength, the full wavelength $\lambda$ is twice this distance. Thus, $\lambda = 0.17 \times 2 = 0.34$ meters. The frequency $f$ of the sound wave can be calculated using the wave speed equation $v = f\lambda$, where $v$ is the speed of sound in air. Rearranging the equation for $f$ gives $f = v / \lambda$. Substituting the given values yields $f = 343 / 0.34 \approx 1008.82$ Hz. Therefore, the frequency of the sound wave is approximately 1009 Hz, indicating a sound that is within the audible range for humans.
Example 4: Understanding Pressure-Distance Graph Features
On a pressure-distance graph, you observe that the sections representing compressions are significantly taller than those representing rarefactions. What does this tell you about the sound wave, and how might this affect the sound’s perception?
Click here to show/hide answer
When compressions appear significantly taller than rarefactions on a pressure-distance graph, it indicates that the sound wave has a high amplitude. This is because the amplitude of a sound wave is determined by the maximum pressure difference from the equilibrium position, which would be represented by the height of the compressions in this context. A high amplitude implies that the sound is loud. Thus, the significant difference in height suggests a loud sound wave with strong pressure fluctuations. This would likely result in the sound being perceived as louder by a listener, assuming the frequency of the sound is within the audible range for humans. The quality of the sound, such as its timbre or pitch, would not be directly affected by this characteristic, but the increased loudness could make the sound more prominent or potentially more disturbing, depending on the environment and context in which it is heard.